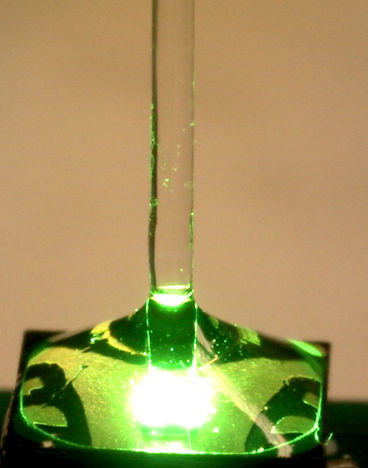
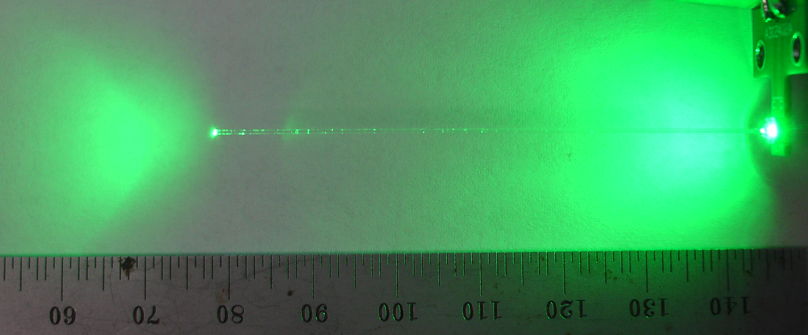
Thursday, May 30, 2013

Higher-Index Fiber

We receive from Fiberoptics Technoligy a new batch of fiber. As with our High Index Fiber, the core occupies 83% of the cross-section and the cladding the remaining 17%. This time, the core is made of a proprietary glass of refractive index 1.72, which they call TD5. The cladding is Schott 8250. The core numerical aperture is 0.86.

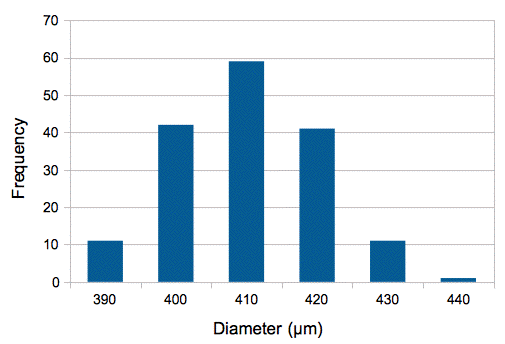
The fiber is divided into 178 sections, each 9 m long, so that the total length of fiber is around 1600 m. We took a 10-cm sample from each 9-m section and measured its diameter. Of these, 165 had diameter 390-440 μm, and 13 had diameter 130-310 μm. We set aside the thinner fibers and consider the 165 larger fibers. The histogram below shows the distribution of their diameters.


Figure: Distribution of Section Diameter

We were hoping for an average diameter of 440 μm and a range of 400-480 μm. What we have is an average diameter of 411 μm with range 390-440 μm, which is similar to the distribution of our previous high-index fiber.

From the 1600 m of fiber we have 100 m with diameter 430 μm or higher. We need 50 mm to make one 8-mm fiber taper, so we have enough fiber in stock to make two thousand fiber tapers of base diameter 430 μm. According to our calculations, the 430 μm diameter should capture and transport 64% of the light emitted by an EZ500 LED. With 30 mA of LED current and 28 mW of blue light emitted, we are hoping to see 18 mW at the fiber tip.

UPDATE: [28-JUN-13] We find a piece of TD5 fiber with diameter 450 μm. We polish both ends of a 80-mm length. We cover 20 mm of the fiber with nail polish. We run 30 mA through an EZ500 460-nm blue LED and obtain 31 mW emitted power. We lower the fiber onto the LED and obtain 16 mW at the fiber tip, which is 50% capture efficiency, and consistent with our earlier calculations for a fiber of numerical aperture 1.72 and diameter 450 μm.

Friday, May 10, 2013

Diameter Variation

We have of order 300 m of optical fiber with numerical aperture 0.66 (core index 1.63, cladding 1.49). When we first received the fiber, we measured its diameter in one place and obtained a value 390 μm. Since then, we have assumed all fibers we cut from our 300-m batch are 390 μm in diameter. Today we cut 225 sections each roughly 30 cm long from our 300-m batch. We measured the diameter of each section with a micrometer. Our resolution in measuring diameter is 3 μm with our micrometer. We obtain the following histogram.


Figure: Distribution of Diameter Among Samples.

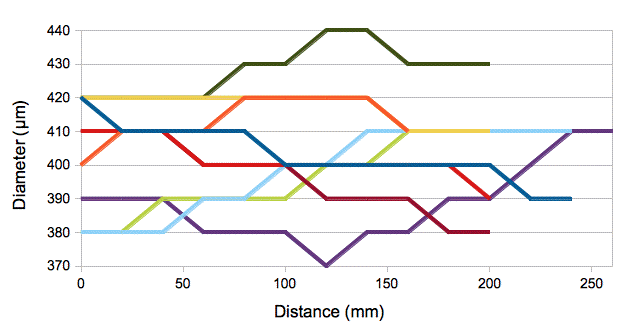
The nominal diameter of the fiber, as supplied by Fiberoptics Technology, was 0.016", or 406 μm. We find the average diameter to be 405 μm, with standard deviation 12 μm. The minimum diameter is 370 μm and the maximum is 440 μm. We measure diameter along the length of a selection of fibers and obtain the following plots. The most rapid change in diameter we observe along a fiber section is 30 μm in 100 mm. Along an 8-mm ISL fiber, we would see no more than a 0.6% change, which is insignificant for our purposes.


Figure: Changes in Diameter With Position.

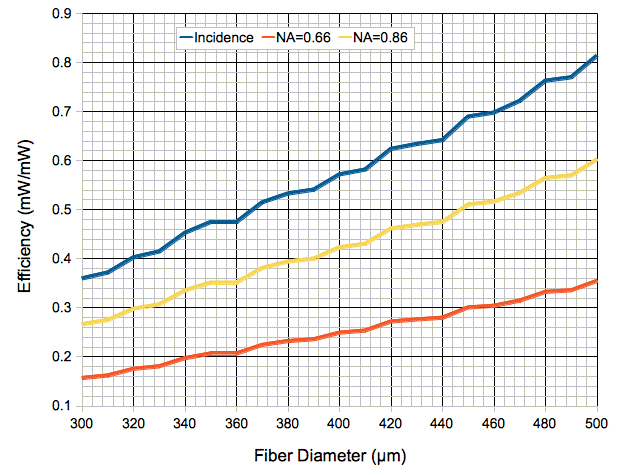
The following graph uses shows how we expect the coupling efficiency of a fiber to increase with diameter, using the calculation we presented in Diameter and Location, and assuming optimal positioning of the fiber on a blue EZ500 die. We assume that the fiber always has 87% of its area occupied by the core, and we consider only the light entering and captured by the core.


Figure: Calculated Coupling Efficiency versus Outer Diameter of Fiber. We show the light incident upon the core of the fiber base as a function of outer diameter of the base, and we show the light fraction of light carried to the far end for NA = 0.66 and NA = 0.86.

We observed 27% and 30% coupling efficiency with sections of our NA = 0.66 fiber. Until now, we assumed the fiber diameter was uniformly 390 μm, and so we were puzzled with these high coupling efficiencies. But we now see that a diameter of 420 μm would give us close to 27%, and 440 μm would give close to 30%.

We plan to order NA = 0.86 fiber (core index 1.72, cladding 1.49) from Fiberoptics Technology. Variation in diameter as we observe in our NA = 0.66 batch would serve us well, because we would have a range of diameters to choose from. A nominal diameter 440 μm (0.0173") with tolerance ±35 μm (0.0014") should produce a useful batch.

Wednesday, May 8, 2013

Diameter and Location

We obtain the following picture of 460-nm EZ500 flashing with 80-mA forward current for a few microseconds. We obtain the photograph with a Camera Head (A2075B) and two neutral density filters. Only 0.1% of the light emitted by the LED passes through the filters.


Figure: Intensity of Light At Surface of Blue EZ500

We extract the pixel intensities from this image and find that the intensity at the center is double the intensity near the edges. We write a program that calculates how much light will be incident upon the base of a fiber pressed against the LED surface, as a function of the fiber diameter and its offset from the center of the LED square.


Table: Calculated Fraction of EZ500 Light Incident Upon Fiber Base. We assume the core is 83% of the cross-section, or 91% of the diameter. Also shown are the fraction of light that will be coupled to the core for various fiber numerical apertures.

The table gives the optimal location of the fiber center, as an offset from the center. An NA = 0.66 fiber with outer diameter 390 μm has core diameter 355 μm. The best place for such a fiber is 40-μm from the LED center, in the direction opposite to the bond pad. We apply our capture efficiency relation to the light incident upon the fiber for three values of numerical aperture. We obtain estimates of the fraction of light emitted by the LED that will be transported along the fiber, which we call the coupling efficiency. The NA = 0.66 fiber is the one we have now, the NA = 0.86 fiber is the one we hope to obtain, and the NA = 0.22 is an industry standard. Our calculation suggests that our existing NA = 0.66 fiber, with its 355-μm diameter core placed 40 μm off-center on the LED surface, will transport 23% of the light emitted by the LED.


Figure: Optical Power Output versus Forward Current. We try three C460EZ500 LEDs.

The graph above shows the optical power output of three C460EZ500 LEDs. We see that they emit up to 28 mW at forward current 30 mA, which is far more than the 18 mW emitted by the C470EZ290. The average power output at 30 mA is 27.5 mW. If we combine these diodes with a 440-μm diameter fiber with a 400-μm diameter core of numerical aperture 0.86, our calculation suggests that we will get 15 mW out of the fiber tip.

UPDATE: [10-MAY-13] See Diameter Variation for plots of incidence and efficiency versus the outer diameter of the fiber, using same calculation described above.

Tuesday, May 7, 2013

Polishing, Cleaning, and Curing

The base of the ISL fiber must be flat and perpendicular to the fiber axis. Light entering a flat base will bend towards the fiber axis. The base must be smooth also: scratches will scatter light that would otherwise enter the fiber. And it must be clean, for dire will absorb light. We can check that a fiber tip is perpendicular, flat, smooth and clean with a specialized microscope we call a fiberscope.

We polish our high-index fiber in the following way. We break off a 5-cm length by crushing both ends with a diamond scribe. We do not scratch and pull nor scratch and bend. These methods produce a longer break. The crushed break leaves only 300 μm of damaged glass. We take the fiber in our fingers and polish it on wet 15-μm grit paper until the damaged glass is gone, which takes about a minute. We do this for both ends, so that both ends are now slightly concave. We place one end in a 440-μm diameter ferrule mounted in a polishing puck. The 390-μm fiber is a loose fit in the ferrule. We press the top end of the fiber to apply polishing pressure, and are now glad that it does not have any sharp spikes of glass left on it from the break. We polish on a flat surface with wet 15-μ grit for thirty seconds. We now have a flat, perpendicular surface. We move to wet 3-μ grit for thirty seconds, then 1-μm grit for thirty seconds. We clean the tip by brushing it along a piece of acetone-soaked lens paper. In the fiberscope, we see the 355-μm core and the 390-μm cladding around it, and a few light scratches. We polish and inspect the other end in the same way.

Now we clean the fiber walls. We hold both ends in acetone-soaked lens paper and clean by stroking away from the center. We do not use alcohol because it leaves a residue. We do not use water because it does not dissolve the oil left upon the fiber by our fingertips.

We place our polished, clean fiber in our alignment fixture and lower it over an LED. For today's experiments we use left-over 290-μm square green EZ290 LEDs with a central bond wire. We press the fiber base onto the bond wire. We turn on the LED. If we have polished the base well, we see no light leaking out of the fiber walls near the base. The only light visible in the neighborhood of the base is the light escaping through the gap between the fiber and the LED. If we have cleaned the walls well, no light emerges from the walls all along the length of the fiber, except where the steel clamp touches the glass. The LED emits 9.0 mW of green light with forward current 30 mA, and we get 6.7 mW out the top end. That's 75% coupling from the LED to a point 5 cm away.

The fiber core has refractive index 1.63 and the air outside has index 1.00, so the numerical aperture of this air-clad fiber is bigger than 1.0. Any light entering the base should propagate to the tip, assuming the walls are in contact only with air. Any dirt on the walls will shine with green light escaping from the fiber. Any residue on the fiber will glow with green light.

Assuming a perfectly-prepared fiber, there remain four sources of loss in our system, and we suppose these add up to 25%. First, there is roughly 4% reflection from the base of the fiber, for light entering at 0-80°. At higher angles, more light is reflected. Let us suppose we lose 6% this way. Some light escapes through the gap between the fiber and LED, and with our photodiode we estimate this to be around 5% also. At the top end of the fiber we have another reflection of 4%. This leaves 10% loss at the steel clamp, which is consistent with how brightly the walls glow inside the clamp. We conclude that our polishing is effective, and our cleaning also.

We apply NO13685 adhesive to the fiber walls above the clamp. This adhesive is runny like water and has refractive index 1.37. No light escapes from the fiber. Power at the tip remains 6.7 mW. We attempt to cure the NO13865 in place, with a UV light. The adhesive evaporates and the walls glow with green light. Power at the tip drops to around 5 mW. It appears that the coating evaporates before it can cure.

We apply NO164 adhesive to a spot on the fiber wall below the clamp. This adhesive has refractive index 1.64. The spot shines brightly with green light escaping from the fiber. As we place dots of NO164 farther down the fiber, they glow brightly and the higher ones go dim. Light from the top of the fiber drops to 4.6 mW.

With the NO164 spots higher up on the fiber, we apply a drop of NO164 between the fiber and the LED surface. This adhesive matches the refractive index of the fiber core, so that scratches in the face of the fiber will no longer act to scatter light. But we see no increase in power at the fiber tip with the NO164 between the base and LED. We repeat the experiment several times, and occasionally we see less power at the tip, which we believe is the result of bubbles trapped between the base and the LED.

We apply adhesive to a freshly-prepared horizontal fiber in a chamber filled with dry nitrogen gas, and illuminate through a thin plastic window with UV light. After two minutes we apply another coat, and continue until we have five coats, which we cure for another ten minutes. We wash with acetone and find that we have removed the adhesive.

We try MY133, another adhesive which is less runny and has refractive index 1.33. We apply one coat to a fiber. It beads up on the fiber and begins to harden. After ten minutes in our curing chamber, it is still tacky to the touch and a layer in a petri dish is still runny. (The lamp intensity is 14 mW/cm2 and this adhesive needs only 2 J/cm2 to cure.) We polish the fiber tip to remove adhesive and lower onto our LED. There are glowing spots in the coating, which suggest dirt embedded in the adhesive. We get 5.9 mW out of the fiber tip.
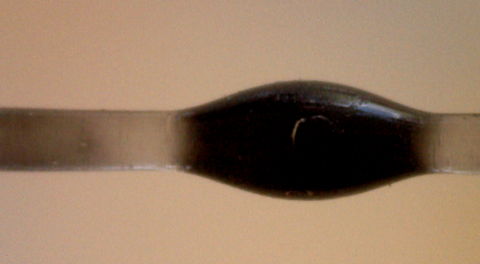


Figure: A High-Index Fiber Coated with Epoxy. The beads from as a result of surface tension and viscosity. Similar beads appear with MY133 adhesive, but not with the runny NO13685. This epoxy-coated fiber transports 30% of the light emitted by a blue EZ500 (480-μm square die).

The beading up of a coating on a fiber is incompatible with our ISL application. The photograph shows shows beads of epoxy on a length of our high-index fiber. The beads can be double the diameter of the fiber. The beads form in viscous adhesives whether we mount the fiber vertically or horizontally. Runny adhesives do not form beads, but they evaporate in the heat of the UV lamp before they cure.

We spilled our bottle of MY133, which will cost $400 to replace. Even if we can solve the problems of cleaning and curing these adhesives in a thin, uniform layer on our high-index fiber, we are not sure how we can apply a coating to an 8-mm fiber with a tapered tip. None of these adhesives can survive the temperature required to melt glass. We would have to coat the base of a 5-cm fiber, mount it in the stretcher, heat the glass to make the taper, then coat the glass up to the taper.

We conclude that the application of these coatings will be expensive, time-consuming, and unreliable. We will try to obtain cladded fiber with core refractive index 1.7 or greater. Such a fiber would provide us with sufficient numerical aperture on its own, and so greatly simplify the production of the ISL tapered fibers.
Tuesday, April 30, 2013

Discharge Rate and Capacity

We experiment with two types of lithium-ion battery. One is the PP031012AB, with nominal capacity 19 mA-hr. The other is the 382030 with nominal capacity 150 mA-hr. The small one we consider suitable for implantation in mice, and the larger for implantation in rats.

The data sheets give a maximum charging current of 9 mA and 80 mA for the small and large batteries respectively. We begin by charging the small battery at 20 mA and the large one at 150 mA until the battery voltages reach 4.3 V. We discharge both with resistors, and we find that the battery capacity is roughly half nominal.

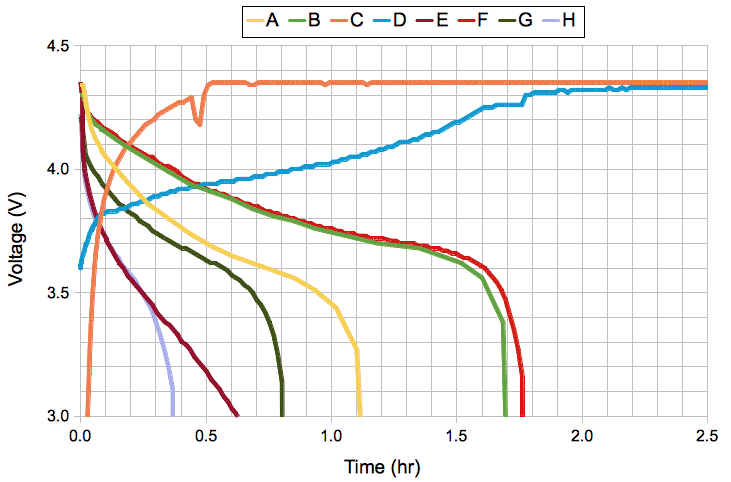
We now charge the batteries by the rapid-charge procedure specified by their data sheets. We supply 9 mA to the small battery and 150 mA to the large battery until their voltages reach 4.3 V, then we apply constant voltage of 4.3 V until the battery current drops to 10% of the rapid charge current. After two hours, both batteries appear to be fully charge. We discharge them with resistors. The graph below shows the small battery discharging through a 200-Ω resistor (A) and the large battery discharging through a 40-Ω resistor (B).


Figure: Charging and Discharging Lithium-Ion batteries. Lines A and B showing the discharge of the small battery through 200 Ω and the large battery through 40 Ω. Lines C and D show the small and large battery charging up to 4.3 V. Lines E and F another discharge with the same resistors. Line G is the large battery discharging through 20 Ω, and H is discharging through 10 Ω.

At 3.7 V the discharge currents (A and B) are 18 mA and 92 mA respectively. While discharging to 3.0 V, the small battery delivers 20 mA-hr and the large one delivers 160 mA-hr. The small battery discharges completely to 0.0 V through the 200-Ω resistor. The large battery is equipped with a protection circuit that disconnects it from the 40-Ω resistor when the battery voltage drops below 3.0 V.

We recharge the large battery at 150 mA (C) and the small battery at 9 mA (D). We discharge through the same resistors (E and F). The large battery provides 162 mA-hr but the small battery provides only 11 mA-hr. The small battery has been damaged by its complete discharge to 0.0 v. We re-charge the large battery and discharge it through 20 Ω (G). At 3.7 V, the discharge current is 185 mA. The battery provides 148 mA-hr. We re-charge and discharge through 10 Ω (H). At 3.7 V, the discharge current is now 370 mA and the battery still provides us with 130 mA-hr.

Lithium-ion battery data denote the nominal capacity of a battery in mA-hr with the letter C. For our large battery, C = 150 mA-hr. The rapid charge current is 1.0C mA = 150 mA. The maximum discharge current is 160 mA, which is 1.1C mA. The smaller battery has C = 19 mA-hr, but its rapid charge current is only 0.5C, or 9 mA, and its maximum discharge current is also 0.5C.

It takes one or two hours to charge a lithium-ion battery to its nominal capacity 1.0C. When we discharge at 1.0C mA, the capacity drops to 0.9C mA-hr, and discharging at 2.0C mA, the capacity drops to 0.8C mA-hr. If we allow the battery to discharge completely to 0.0 V, it loses over half its capacity. Thus we can draw 38 mA continuously from our 19 mA-hr miniature lithium-ion battery and still obtain 15 mA-hr of battery life.

Tuesday, April 23, 2013

High-Index Fiber

We receive from Fiberoptics Technology several hundred meters of 0.016" clad rod, F2/8250. We measure its outer diameter as 390 μm. Its core is Schott F2 glass and its cladding is Schott 8250. The core occupies 83% of the fiber cross-sectional area. We have a 355-μm diameter core with a 17-μm layer of cladding. The rod is so thin we can bend it in a 10-cm radius, and the core has refractive index 1.63, so we will call it high-index optical fiber.

We take a 5-cm length of fiber and polish both ends. We try to use hot-glue to hold the fiber in a ferrule, which is our usual method with silica glass, but when we try to remove the hot glue with a propane flame, the glass melts. The F2 glass melts at only 434°C compared to 1100°C for the silica we usually work with. Our flame-based tapering machine will not taper this glass. We will have to develop a lower-temperature heater to take the fiber just above its glass temperature for tapering. We will have to devise a reliable method for polishing the flat end of the fiber without the use of hot glue. For now, we did the best we could holding it between finger and thumb.

We clean the fiber and coat it with NO13685 adhesive. This adhesive has the consistency and appearance of water when applied, and cures to a tacky solid in UV light. Its refractive index is 1.3685. We lower this fiber onto a green EZ500 LED. We pre-cure the coating, then add clear epoxy to hold the fiber in place, and cure further while blowing nitrogen over the exposed coating. (The coating cures to a non-tacky, flexible solid only in the absence of oxygen.) We turn on the LED and take a photograph of the fiber base with our microscope, shown below on the left.


Figure: High-Index Fiber with NO13865 Coating. Left: first attempt, note the epoxy holding the fiber onto the LED. Right: after cleaning the fiber with acetone and re-coating.

In the left-hand picture we see light escaping from the bottom of the fiber, from dirt beneath the coating, and from the meniscus of the epoxy where it encloses the fiber. The fiber tip emits 19% of the LED light (2.6 mW of green light from a total of 13.6 mW generated with 30-mA forward current). We wipe the fiber repeatedly with acetone. The coating comes off and we continue to clean the fiber until hardly any signs of dirt remain. We coat the fiber again, and cure the coating. We obtain the photograph on the right. The fiber tip now emits 24% of the LED light (3.2 mW). The signs of dirt on the coated fiber are greatly reduced, but we still see the same ring of light at the limit of the epoxy.

If we assume light is distributed uniformly across the 480-μ square area of the EZ500, then 43% of its light should enter our 355-μm fiber core and 9% should enter its cladding. The core of index 1.63, combined with the coating of index 1.3865, gives us a numerical aperture of 0.87, so we expect 76% of the light in the core to reach the tip. The cladding has index 1.487, and is combined with the same coating, so it has numerical aperture 0.58 and we expect 34% of the light in the cladding to reach the tip. Adding these up, we expect to get 36% of the LED light at the fiber tip. We see only 24%.


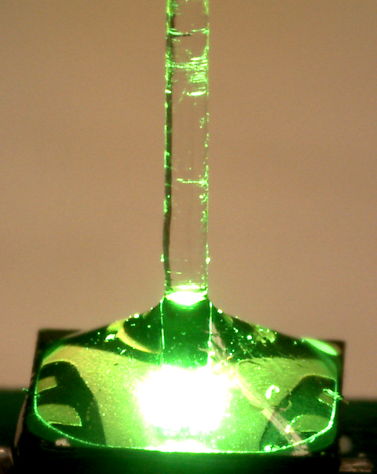
Figure: A 5-cm Coated Fiber on Green EZ500.

The photograph above shows that the light leaking from the exposed length of the fiber is small compared to the light emitted by the tip. Our close-ups of the base of the fiber, however, show a ring of light being lost from the fiber at the limit of the epoxy. It could be that the coating was improperly cured and the epoxy penetrated to the fiber glass along the epoxy meniscus. The epoxy has index 1.5, which reduces the numerical aperture of the cladding to 0.00 and the core to 0.61. A sufficiently lengthy contact between the epoxy and the glass would reduce the fraction of light reaching the tip from 36% to 16%.

Another potential loss of power at the tip is poor polishing of the fiber ends. In the past, we have observed 10% loss of power due to slight imperfections in the polish. The polish on the ends of this fiber is far from perfect.

Nevertheless, we are now seeing 24% of the LED light at the fiber tip, which is better than our previous record of 17%. When combined with our new and more efficient blue LEDs, this fiber would give us 7.2 mW at the fiber tip for a 30-mA LED current.

In the future, we will try the MY132 coating, with refractive index 1.325. This alone will increase our theoretical coupling efficiency from 36% to 42%. We may also find that the LED light is concentrated towards its center, as we did before, where a 300 μm fiber captured 9/5 as much light as we expected. Thus we might obtain up to 75% of the LED light at the tip.

UPDATE: [26-APR-13] Spoke to Adam at Norland Products and decided to try NO1625 and NO164 adhesives to glue the base of the fiber to the LED. These adhesives have refractive index 1.625 and 1.64 respectively, so they should fill scratches in the fiber base and give us a reliable optical connection between the silicon surface and the core glass.

UPDATE: [03-MAY-13] We achieve 30% capture efficiency with the F2-core fiber and a 460-nm EZ500. The LED emits 27 mW at 30 mA forward current and we see 8.2 mW at the far end of an 8-cm fiber coated with black epoxy. Only the 355-μm core carries light. Its numerical aperture with the cladding is 0.67. We expect 43% of the LED light to enter the fiber, and 45% of this light entering to reach the other end, for a total capture efficiency of 19%. With the fiber offset from the LED center, so as to avoid the cathode pad, we get 24%. But when we center the fiber, which requires that we smash down the cathode bond wire, we get 30%.

Monday, April 22, 2013

Lithium-Ion Batteries

The Implantable Lamp (A3024A) is powered by a BR1225 lithium primary cell. Its nominal voltage is 2.7 V and its nominal capacity is 48 mA-hr. It cannot be recharged, and we anticipate that its capacity when providing 10 mA will be closer to 24 mA-hr, because its nominal discharge current is only 30 μA. The A3024A provides 30 mA at 5.0 V for its lamp using a 90% efficient inductive boost regulator. But the battery's internal resistance is of order 40 Ω, and this resistance limits the continuous lamp current to 8.2 mA. The A3024A is equipped with a 1-mF capacitor bank in parallel with the battery, and this capacitor bank allows the boost regulator to flash the lamp for up to 10 ms. The volume of the capacitor bank is roughly the same as the volume of the battery. When we flash the lamp for 10-ms bursts every 100 ms, the battery voltage drops to 1.8 V as it provides an average current of 10 mA. We expect this current to exhaust the battery in 2.4 hrs.

The LIR1220 lithium-ion secondary cell is slightly thinner than the BR1225, has nominal output voltage 3.6 V, output resistance only 2 Ω, and can be re-charged. With its low output resistance, it can supply continuous power to the lamp without the need for a capacitor bank. Its capacity, however, is only 8 mA-hr. Consider instead the PP031012AB lithium-ion battery with capacity 19 mA-hr. Its rectangular shape occupies only 0.25 ml, compared to the 0.31 ml of the circular BR1225. When flashing the lamp 10 ms out of every 100 ms, the battery voltage will remain close to 3.6 V, and the battery will need to supply an average of only 5 mA to the boost regulator. The battery's capacity is 19 mA-hr at a discharge current of 20 mA. Here our average current is 5 mA but the peak current is 50 mA. We expect a slight decrease in capacity as a result, perhaps to 15 mA-hr. Even so, we can flash the lamp for 3.0 hrs with this battery, compared to 2.4 hrs with the BR1225. Furthermore, we can turn on the lamp continuously, although we should be aware that doing so will reduce our battery capacity.

The Implantable Sensor with Lamp (ISL), as we specified in our Technical Proposal, will combine a subcutaneous transmitter, an implantable lamp, and a microprocessor into one circuit that may be implanted in a rat. We are aiming to keep its volume less than 4 ml. Suppose we equip the ISL with a TE382030 battery pack. Its volume is 2.3 ml (30 mm × 20 mm × 3.8 mm), which leaves us 1.7 ml for the circuit, which will be sufficient because we no longer need space for a capacitor bank. The battery has capacity 150 mA-hr when delivering 150 mA continuously. It could flash the lamp with current 30 mA for 10 ms out of every 100 ms for 30 hrs, or it could turn the lamp on continuously for 3.0 hrs. Alternatively, with some lower-resistance lamp leads, we could increase the lamp current to 50 mA, thus boosting the optical power at the fiber tip, and we would still be able to turn on the lamp continuously for 1.8 hrs.

Lithium-ion batteries discharge themselves slowly. Even if we draw no current from them, they lose roughly 5% of their charge in the first month and 2% per month thereafter. This self-discharge, combined with their lower total capacity compared to the lithium primary cells, will shorten their shelf-life to a few months. If we could recharge the batteries before implantation, we could be sure of obtaining the maximum operating life after implantation. If we could recharge the battery while it is implanted, we could greatly extend the duration of our experiments.

The head fixture of the ISL offers us an opportunity to recharge a battery while implanted. Suppose we contrive to place upon the head fixture a sufficiently small, two-way, water-resistant socket. In addition to the L+ and L− leads required by the lamp, we run a B+ lead to the battery positive terminal on the ISL circuit. The B+ and L− wires connect to the two-way socket in the head fixture. When we want to recharge the battery, we connect two flexible leads with pins on the end to the head fixture. These leads in turn connect to an especially-designed battery charger, which we connect to our LWDAQ. The charger measures the resistance of the charging leads and monitors the battery voltage during a rapid charge cycle that will take roughly one hour to complete.

In both the mouse-sized Implantable Lamp and the rat-sized Implantable Sensor with Lamp, it appears that the lithium-ion battery pack provides us with a smaller, longer-lasting, and more capable power supply, even if we do not recharge them. Thus we believe we should switch to lithium-ion batteries for the ISL development regardless of whether or not we can devise a way to recharge the batteries while implanted. Furthermore, we will add a single pad to the ISL circuit that will allow connection to the battery positive terminal, so we can re-charge the battery before encapsulation, and allow for the possibility of recharging through a separate B+ lead to the head fixture.

UPDATE: [24-APR-13] We take an old cell-phone lithium-ion battery and solder wires to its terminals. This is a PBR-55D by Pantech, capacity 1000 mA-hr with nominal voltage 3.7 V. We use a 10 Ω power resistor as a load and a bench power supply as a charger. We have no difficulty charging and discharging the battery, and we find its output resistance to be 1.0 Ω. Further investigation reveals that the standard quick-charge time for lithium-ion batteries is 2.5 hrs. We begin with constant current charging at 0.5C/hr, where C is the battery capacity. When the battery voltage reaches 4.2 V, we switch to constant voltage charging until the charge rate drops to 0.05C/hr.