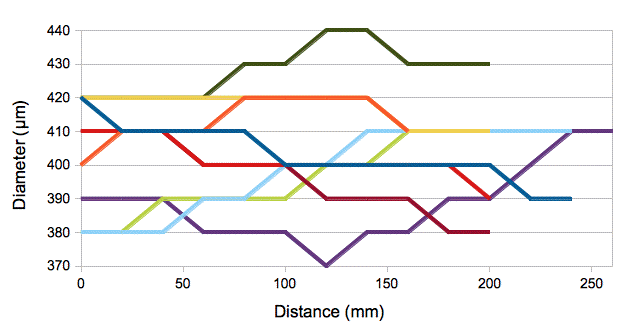
Figure: Distribution of Diameter Among Samples.
The nominal diameter of the fiber, as supplied by Fiberoptics Technology, was 0.016", or 406 μm. We find the average diameter to be 405 μm, with standard deviation 12 μm. The minimum diameter is 370 μm and the maximum is 440 μm. We measure diameter along the length of a selection of fibers and obtain the following plots. The most rapid change in diameter we observe along a fiber section is 30 μm in 100 mm. Along an 8-mm ISL fiber, we would see no more than a 0.6% change, which is insignificant for our purposes.

Figure: Changes in Diameter With Position.
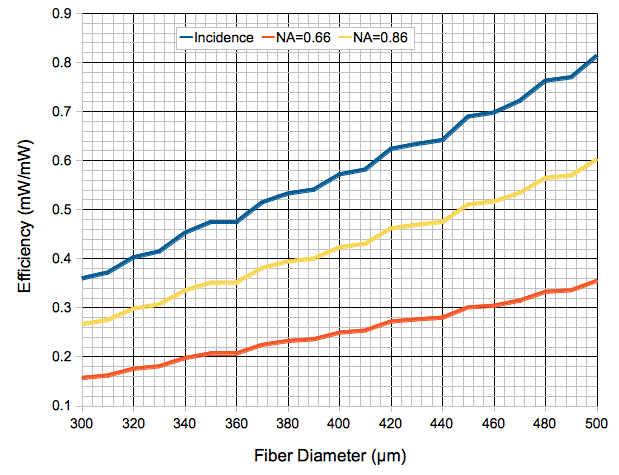
The following graph uses shows how we expect the coupling efficiency of a fiber to increase with diameter, using the calculation we presented in Diameter and Location, and assuming optimal positioning of the fiber on a blue EZ500 die. We assume that the fiber always has 87% of its area occupied by the core, and we consider only the light entering and captured by the core.

Figure: Calculated Coupling Efficiency versus Outer Diameter of Fiber. We show the light incident upon the core of the fiber base as a function of outer diameter of the base, and we show the light fraction of light carried to the far end for NA = 0.66 and NA = 0.86.
We observed 27% and 30% coupling efficiency with sections of our NA = 0.66 fiber. Until now, we assumed the fiber diameter was uniformly 390 μm, and so we were puzzled with these high coupling efficiencies. But we now see that a diameter of 420 μm would give us close to 27%, and 440 μm would give close to 30%.
We plan to order NA = 0.86 fiber (core index 1.72, cladding 1.49) from Fiberoptics Technology. Variation in diameter as we observe in our NA = 0.66 batch would serve us well, because we would have a range of diameters to choose from. A nominal diameter 440 μm (0.0173") with tolerance ±35 μm (0.0014") should produce a useful batch.
No comments:
Post a Comment