Tuesday, November 17, 2015

Conduction Through Tunnels

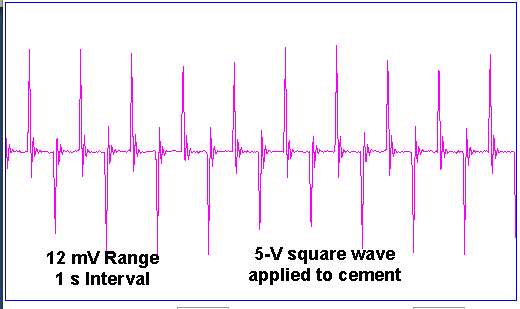
In Electrical Coupling Through Dental Cement we showed that the resistivity of dental cement, wet or dry, was too great to cause the lamp stimulation artifact we observed on X for the first few weeks after implanting D7.2. A few weeks after implanting D7.6, the lamp stimulation artifact is a full-scale square wave, as shown below.


Figure: Lamp Pulse Artifact Two Weeks After Implantation. D7.6, 0% brightness, 10-ms pulses, 100 ms period. See M1447342849.ndf.

At ION on 12-NOV-15, we implant D7.5 and note the insulated exterior of the L+ and X+ leads are touching as we are about to apply dental cement. We believe the previous two implants were done exactly the same way. This time, we move the leads apart. If they were to touch, there would be a passage through the dental cement for water to creep along and so connect X+ to L+. Half an hour after implantation, we generate 0% brightness, 10-ms long pulses, with 100 ms period and see the artifact below on the X input.


Figure: Lamp Pulse Artifact Immediately After Implantation. D7.5, 0% brightness, 10-ms pulses, 100 ms period. See M1447350049.ndf.

We see a step up on X as the lamp power turns on and a relaxation afterwards. Brightness is 0%, so L+ is connected to +5V. When we turn off lamp power, L+ relaxes as a 10-μF capacitor discharges. At no time is Q1 turned on, so at no time is the LED draining the capacitor. With 100% brightness, the artifact on X is a pulse, as shown below. With 100% brightness, L+ drops quickly at the end of a pulse because the LED is connected to L+ for 200 ns after the end of the pulse, and conduction through the LED drains the 10-μF capacitor.


Figure: Lamp Pulse Artifact Immediately After Implantation. D7.5, 100% brightness, 10-ms pulses, 100 ms period. See M1447350049.ndf.

The artifact on X is consistent with a resistive connection between L+ and X+ of around 250 kΩ (the L+ lead carries +5V pulses, the X input's two skull electrodes have resistance is of order 1 kΩ, and the pulses on X are around 20 mV). We take two silicone-insulated steel leads and solder them to the pins of a connector. We cover the connector with dental cement, but leave the solder joints exposed. We tie the two leads in a knot to make sure they are touching. We put saltwater on the joints. We cover the leads, joints, and connector pins with cement. The resistance between the two leads is >40 MΩ (the largest resistance we can measure with our voltmeter). We allow the cement to cure. The resistance is >40 MΩ. We cover with salt water. Resistance is >40 MΩ. We wait half an hour, resistance has dropped to 120 kΩ. We pour away the saltwater and dry the cement surface. Resistance is 100 kΩ. Fifteen minutes later, resistance is 150 kΩ. We bake in the oven at 60°C for half an hour and measure 130 kΩ. One hour later, the resistance is >40 MΩ.


Figure: Conduction Through Tunnels. Visible through the pink cement are two leads we wrapped together to create a passage from one lead tip to another. The pink cement is at this moment covered by clear saltwater.

We know from long experience that water creeps along passages by capillary action. In this case, we have two solder joints being connected along a 20-mm tunnel by saltwater that has crept along the tunnel walls. The resistance of this saltwater connection is 100 kΩ. When implanted, every lead emerges from the head fixture somewhere. Where it emerges, there will be body fluids. And every lead creates a tunnel along which these body fluids can creep to the exposed conductor at the end of the lead. We suggest that these water films are the source of our lamp stimulation artifact.

Tuesday, September 22, 2015

Electrical Coupling Through Dental Cement

We have A3030D number D7.2 implanted at ION since 17-AUG-15. The day after implantation we observe full-scale artifacts on the EEG when transmitting commands, and the following 15-mVpp pulses when flashing the lamp.


Figure: Lamp Flashing Artifact for First A3030D Implanted, D7.2. Archive M1439901477.ndf, 2352 s.

Last week we observed only the 200-μVpp artifact we expect from our tests at OSI. We consider the possibility that dental cement (acrylic and powder) mixed with water is conducting until the water evaporates. We mix up dental cement with and without adding a few drops of water. When we add water, we get drops of water coalescing outside the cement. (Methyl methacrylate is hydrophobic.) Resistance between two probes placed 0.5 mm apart is greater than 10 MΩ in all cases. We cement two wires 5 mm apart and plug the electrodes of a 10-MΩ amplifier into the cement near each wire, but not in contact with the wire.


Figure: Cement Noise Coupling Measurement. We use an A3028E with 10-MΩ input impedance to pick up a 5-V square wave applied to two wires embedded in the cement.

We bake our apparatus at 60°C to make sure it is dry. We apply a 5-V, 10-Hz square wave to the two wires and observe the following on the A3028E output.


Figure: Cement Voltage Coupling. We have 10-MΩ input impedance and a 5-V, 10-Hz square wave applied to the wires.

We cover both amplifier electrodes with a few drops of water. The impedance between the elecrodes is now 600 kΩ measured at 0 Hz. The coupled signal drops to less than 100 μVpp from 10 mVpp. We dry off, apply a 5-Vpp sinusoid, and obtain the following graph of coupled amplitude versus frequency. The slope of the graph suggests the coupling through the cement is capacitive.


Figure: Cement Voltage Coupling versus Frequency. The initial positive slope shows coupling increasing as f. After 160 Hz, the attenuition of the three-pole low-pass filter changes the response to 1/f2.

At 100 Hz, we get 0.1% of the applied sine wave at our amplifier input, which suggests that our 10-MΩ input impedance is 0.1% of the impedance of the coupling capacitance, so that this capacitance is of order 0.2 pF. The dielectric constant of this cement should be around 4, so 0.2 pF can be made with two 2-mm square plates separated by 1 mm. We cut the blue X− lead. The coupled noise remains the same. We cut the X+ lead. The noise drops from 10 mVpp to 100 μVpp.

Our cement does not conduct electricity, even when we add water during mixing. The input impedance of the A3030D amplifier is 100 kΩ. If both electrodes are connected to the brain, the impedance between them will be closer to 1 kΩ. In either case, the noise coupled from a 5-V square wave applied to the same lump of dental cement will be less than 100 μV. Even if we disconnect the X− and leave X attached, artifact will be less than 100 μV.

Conduction through dry or wet cement cannot explain the artifact we observed from D7.2 when it was first implanted. Capacitive coupling cannot explain the artifact either, becasue the A3030D has input impedance only 100 KΩ.

Thursday, July 16, 2015

ISL Stage 7 Delivery

We ship to ION the devices shown below. There are ten Implantable Sensors with Lamp (A3030D) and fifteen Head Fixtures (A3024HF) of various types.


Figure: Batch ISL7 Deliverables. For a close-up of the A3030D see here.

Each ISL provides a 50-mm 915-MHz command antenna and a separate 30-mm 915-MHz data and acknowledgement antenna. The A3030D introduces support for longer interval lengths as well as random pulse generation. We need Version 4 of the ISL Controller Tool to command the A3030D. The new controller tool provides a version menu button to select between the A3030C and the A3030D. In other respects, the use and operation of the A3030D is identical to that of the A3030C we delivered in .


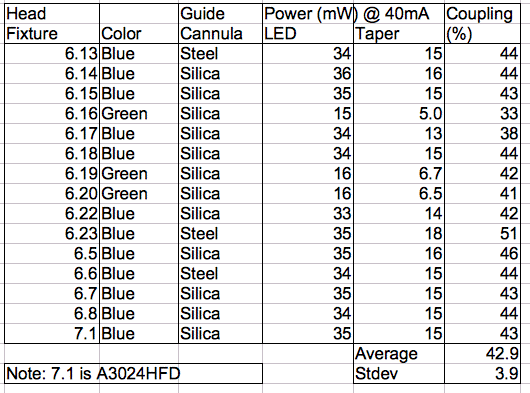
Figure: Output Power, Color, and Cannula Type for ISL7 Head Fixtures. We measure optical power with a photodiode and 40 mA LED current. All head fixtures are A3024HFC, except 7.1, which is A3024HFD.

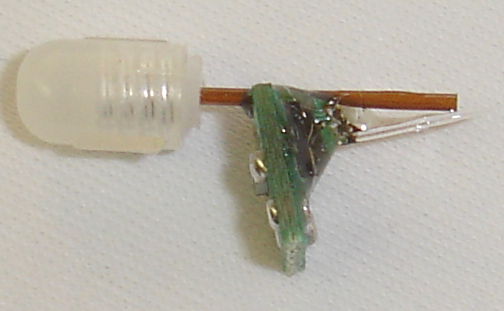
The photograph below shows an example of the ISL7 head fixture with inclined silica cannula guide and cannula dummy installed.


Figure: Silica Guide Cannulas.

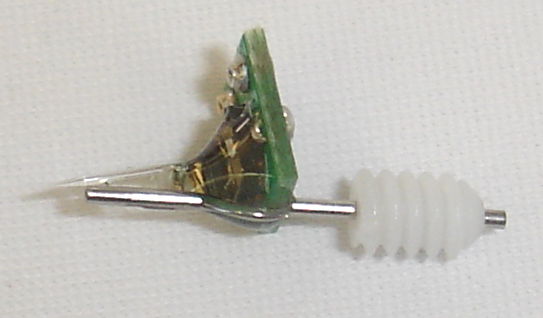
We ran out of cannula dummies and then silica guide cannulas during production of our fifteen head fixtures. Some we are shipping without cannula dummies. We run out of silica cannula guides and have no time to wait for more, so we use 10-mm steel cannula guides instead.


Figure: Steel Guide Cannulas.

We have been using silica guides because we believed they would transport less electrical noise into the brain. But our study of the sources of lamp activation noise suggests that a steel guide will cause no increase in lamp activation noise at the tip of the fiber. The guide will, however, affect the flow of the EEG signal in its neighborhood. We would like to learn from these three steel guides whether the silica guide is necessary or redundant.

We made twelve A3030Ds and all twelve are fully functional after encapsulation. The figure below shows all of them turning on at once in response to a multi-device XON command from our Command Transmitter.


Figure: Twelve A3030Ds Turning on Simultaneously.

We forgot to bind the X and L leads into pairs before we soldered them to our circuit boards. We bound the leads afterward encapsulation, which produced an unattractive finish on the previously smooth and rounded silicone-coated springs, as shown below.


Figure: Imperfect Silicone Binding in X and L Lead Pairs.

We believe there will be no problem implanting these lead pairs, not any compromise of their fatigue resistance due to the cosmetic problems with the finish.

Friday, July 10, 2015

Lamp Power Control

The Implantable Sensor with Lamp (A3030D) provides 0-100% control of the lamp power in steps of 20% by means of modulation of the lamp current, as we describe elsewhere. The 1-MHz modulation frequency is so high as to have no effect upon the activity of neurons nor our EEG amplifier. We connected an EZ500C470 470-nm blue LED to the lamp leads of an A3030D. At 100% power, the LED current is 35 mA. We varied the output power from 1-100% and measured battery current and optical output power of the LED at each step.


Figure: Optical Output Power and Battery Current versus Lamp Modulation Duty Cycle. Switching transistor is the NTR4003N. Compare to this measurement of modulation current in ISL5/6, which used the NDS355AN switching transistor.

The average ISL7 head fixture couples 44% of the LED light to the tip of its fiber. At 100% power, the LED produces 30 mW and we expect 13 mW at the fiber tip. The battery current and light intensity scale almost linearly with power setting. If anything, the 40% power setting is slightly more efficient in its conversion of battery energy into light energy than the 100% setting.

Prompt Acknowledgment

The Implantable Sensor with Lamp (A3030C) for ISL6 provided acknowledgment messages in response to acknowledgement request instructions from the Command Transmitter (A3029B). The transmission of these acknowledgements was, however, delayed by up to 2 ms after the A3030C processed the acknowledgment request. This meant that the best synchronization we could obtain between lamp pulses and the recorded X signal would be ±1 ms. One of our objectives for ISL7 is to improve the precision of the lamp and recording synchronization.

The Implantable Sensor with Lamp (A3030D) for ISL7 transmits an acknowledgment a fixed 60 μs after it processes a request. The ISL Controller V4 requests an acknowledgment immediately before it initiates a stimulus cycle, so the delay between the reception of the acknowledgment and the start of the first light pulse of the stimulus is deterministic. The figure below shows the delay for 100-Hz pulses.


Figure: Prompt Acknowledgment Timing with Respect to First Lamp Pulse. Top trace has a 60-μs pulse marking the moment the acknowledgement is transmitted. Bottom trace has a longer HI interval that marks the start of the first light pulse.

For a 10-ms interval (100-Hz pulses), the delay is 750 μs. When we increase the interval length to 100 ms (10-Hz pulses), the delay is 6.3 ms. The delay is a fixed 150 μs plus 2/33 of the interval length. The A3030D's prompt acknowledgments should allow us to synchronize stimulus and recording within a fraction of a millisecond.

ASIDE: While working on the prompt acknowledgments, we discovered that the A3030's radio-frequency oscillator, which is the same oscillator we use in our subcutaneous transmitters, needs roughly 50 μs to stabilize when it has been inactive for more than 100 ms. When transmitting at 512 SPS, the oscillator is never inactive for more than 2 ms. But in the ISL, we can request acknowledgment even when the data transmission is disabled, and in that case, the A3030C of ISL6 did not allow sufficient time for the oscillator to stabilize, so that acknowledgments were unreliable when data transmission was turned off. In the ISL7 we turn on the oscillator 60 μs before any acknowledgment transmission, and we get 100% reception of acknowledgments under all circumstances in a faraday enclosure.

Friday, July 3, 2015

Optogenetics Growth

The National Center for Biotechnology Information (NCBI) provides a database of published neuroscience papers. We used the database to obtain a count of the number of optogenetics papers published each year for the past ten years and obtained the figure below.


Figure: Number of Optogenetics Papers Published versus Year. The final point is a projection based upon the number published so far in 2015.

In the first seven months of 2015, 402 optogenetics papers have been published, as you can see for yourself with this search link. Assuming a constant rate of publication for the next five months, we project the total number in 2015 to be 689, and we added this point to the end of our graph.

Wednesday, June 24, 2015

Random Pulses

Firmware A3030D01.vhd for ISL7 (A3030D) is debugged and running. It provides random lamp pulses for any interval and pulse length. For a view of the modulation noise generated by random pulses, see our previous post. The ISL7 stimulus length is the expected number of pulses. The interval length is the average pulse period in milliseconds. The pulse length as a fixed multiple 30.5 μs.

The A3030D divides each pulse interval into thirty-two sections. For regular pulses, the A3030D always initiates a pulse in the first section and only in the first section. For random pulses, the A3030D initiates a pulse in each section with probability 1/32. Thus the average period of pulse initiation is the same as the interval length. With pulses longer than one section length, the pulses overlap. Pulses that occur at the end of an interval can overlap pulses occurring at the beginning of the next interval.

With 2-s intervals and 100-ms pulses, we counted 100 pulses in 207 s. With 100-ms interval and 10-ms pulses, we used a recording of lamp modulation noise to count 559 pulses in 60 s. The figure below shows the distribution of the number of pulses we counted per one-second recording interval.


Figure: Distribution of Pulses per Second for Random 10-ms Pulses with 100-ms Interval. Average pulse rate is 9.3 pulses/s. For 32-s view of recording and spectrum, see here.

We appear to have a passable approximation to a Poisson distribution of pulse generation. When the pulse length is significant compared to the interval length, the average number of pulses drops because the pulses are overlapping. But we still get 9.3 pulses/s average for 10-ms pulses at 10 Hz.

NOTE: The ISL6 accepted the interval length in multiples of 30.5 μs rather than 1 ms, so the ISL Controller Tool 4.1 has a version selector that allows it to control both ISL6 and ISL7 devices.