Monday, November 5, 2012

Fiber and Cannula

The ISL head fixture is supposed to hold a cannula for injections, a fiber for optical stimulation, and an electrode for EEG monitoring. In our conceptual design, we imagined a head fixture made out of plastic, as you can see here. This original fixture turns out to have several problems. The plastic body of the fixture will obstruct the surgeon's view of the skull hole, making vertical alignment difficult or impossible. The angled cannula deprives the surgeon of a vertical thread by which to hold the fixture during implantation. The proposed gold-pad grounding upon the fixture base might be covered or interfered with by the dental cement used subsequently to hold the fixture in place. To solve these problems, we propose the following, simpler head fixture.


The cannula is a C313GT or G313GFS from Plastics One, with the thread cut short. The fiber is a 330-μm outer diameter, 300-μm core silica fiber with polished base and tapered tip. The fiber is glued above a bare LED die in a 3.1-mm wide, 0.8-mm high package, which is in turn mounted on a 7-mm long 0.8-mm thick fiberglass printed circuit board. The circuit board provides a hole for the cannula. It provides footprints for isolating inductors that allow the L+ lead to be used as an RF antenna. It provides pads for two helical leads that carry L+ and L−.

The angle between the center-line of the fiber and the cannula will be roughly eight degrees, which is close to the half-angle of the fiber taper. Thus we expect the taper edge to be roughly vertical on the side closest to the cannula. When we insert a syringe down the cannula, its open end should face the fiber. By this means, whatever chemical it introduces into the brain tissue will move towards the fiber. The fiber tip will illuminate the treated tissue.

We provide the X+ electrode for monitoring local field potential with a 3-mm length of steel tube around the fiber. This tube does not extend to the base of the taper, but stops 0.5 mm short of the base, so as to allow access by the syringe to the illuminated tissue. The X- electrode will act as the EEG ground terminal. We propose a steel skull screw with a steel washer to extend its area of contact with the top of the skull.

The head fixture as shown consists of two pre-assembled parts. Part A is the fiber, LED, and printed circuit board. These we will assemble as one pice. Part B is the cannula. With the help of a mounting hole in the printed circuit board, the thread on the top of the cannula, and an adjustable assembly jig, we will align both pieces correctly. With the help of some tape and two stages of application, we will fill the gap between the fiber and cannula with epoxy for the stretch between the printed circuit board and the EEG electrode. Once glued together, parts A and B form the finished head fixture. This procedure allows for us to locate the fiber tip precisely with respect to the cannula center-line even if we encounter variations in the length of individual fibers and cannulas.

To implant the ISL head fixture, the surgeon holds it by the cannula threads and lowers it into a skull hole at least 1.6 mm in diameter. After setting the vertical position to their satisfaction, he places two skull-mounting screws nearby. He builds up dental cement around the screws and head fixture so as to bind the fixture to the screws and seal the hole in skull.

Friday, October 12, 2012

Command Transmitter-Receiver

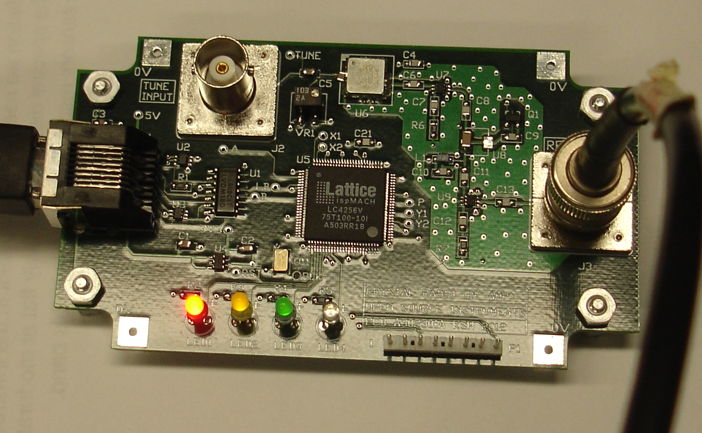
The Command Transmitter-Receiver (A3023) is intended to test the command receiver we propose for the ISL (Implantable Sensor with Lamp) in our Conceptual Design. The A3023 is a LWDAQ Device in two parts. The Command Transmitter section contains a 146-MHz (2-m band) VCO, RF amplifier, and RF switches to provide 100% amplitude modulation. The Command Receiver section contains a tuner circuit, a demodulator, a comparator, and two indicator lamps.


Figure: Command Transmitter. This is the left-hand side of the A302301A circuit board. This particular circuit has all components loaded except for U8, which is bypassed by a 1-μF P1206 capacitor.

The Command Transmitter provides a BNC input to modulate its VCO, a BNC output for its RF power, and a LWDAQ device socket through which we can control the two RF switches and power to the RF amplifier. The Command Receiver provides two-pin connectors for RF input, 3-V power, and binary power detector output.


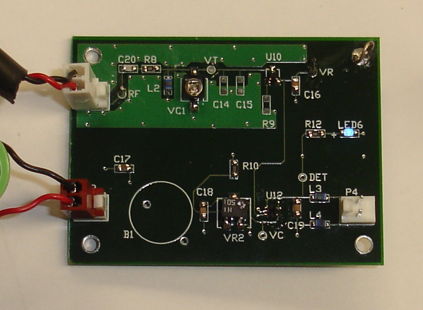
Figure: Command Receiver. Circuit power is supplied by a battery through the connector on the lower left. The RF command signal enters through the connector on the upper left. Two blue LEDs, one on the top and one on the bottom of the board, indicate when the power detector output is HI.

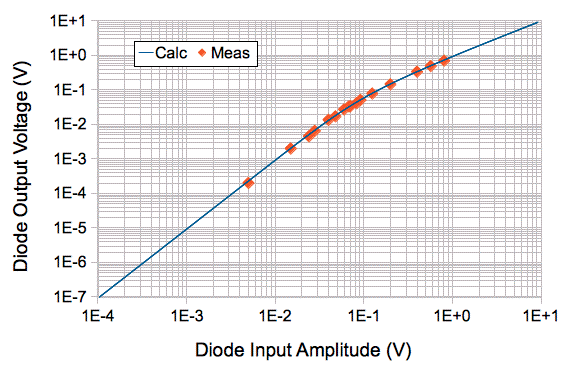
We present the results of our work with the Command Transmitter-Receiver circuit in our A3023 Manual. Here we offer a few highlights. The following graph shows the excellent agreement between our calculated and observed detector diode performance.


Figure: Detector Output versus Input Amplitude. The input amplitude is half the peak-to-peak amplitude. Measurements obtained at 8 MHz and 19°C. Calculations obtained with numerical integration.

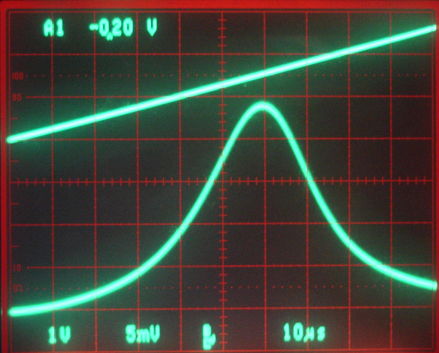
The following figure shows the performance of our 146-MHz tuning circuit. The peak is sharper than we hoped for, and the attenuation at high frequencies is greater, thus giving us better than expected rejection of the 910-MHz data frequency.


Figure: Resonance of 148-MHz Tank Circuit. The top trace is the TUNE input to the VCO, which rises from 0 V to 2.5 V, during which the frequency increases from 118 MHz to 175 MHz. The bottom trace is the detector diode output.

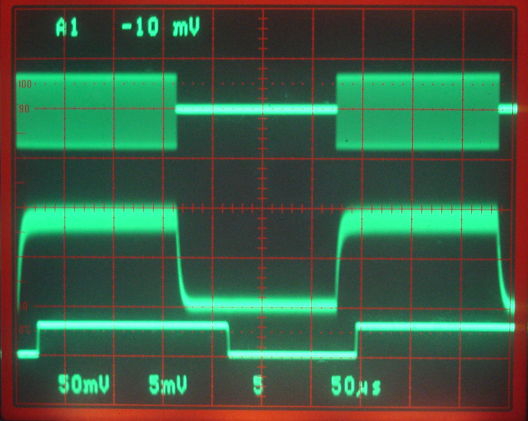
Here we see the modulation of our 146-MHz command frequency, and how it is detected with the help of a diode and a comparator in our Command Receiver.


Figure: Power Detection with 60-mV 146-MHz Input. We have C16 = 270 pF. The top trace is the RF input, 50 mV/div. Center trace is the diode output, 5 mV/div. The bottom trace is the output of the comparator. The time scale is 50 μs/div.

The Command Receiver presents one of the biggest technical challenges we describ in the ISL Conceptual Design. Our greatest concerns were the reliability of command reception at ranges up to 50 cm, rejection of data frequency power, and its current consumption while receiving 8 kbits/s. The Command Transmitter circuit is far less challenging because we have ample power and space in which to produce a modulated signal of adequate power. The receiving antenna we have little control over, because we are hoping to use one of the ISL's pick-up leads. But the transmitting antenna must be efficient, compact, and omnidirectional.

Our prototype Command Receiver consumes less than 1 μA and is effective at rejecting the maximum possible data frequency power it might receive from a nearby subcutaneous transmitter. With the prototype Command Transmitter equipped with a quarter-wave, unterminated, loop antenna, and the Command Receiver held in one hand, moving at random at range 20 cm, reception is at least 99% reliable. Given that the our prototype Command Transmitter generates only 80 mW of power for the antenna, we are confident that with 500 mW we will obtain reliable reception at 50 cm.

What remains to be determined is the performance of the command reception within a faraday enclosure. The reflecting surfaces of the faraday enclosure produce reception dead spots, and the absorbers present in our existing enclosures are less effective at 146 MHz. We are confident, however, that we can overcome the effect of internal reflections by suitable design of the antenna and addition of different absorbers.

One thing we must accept, however, is that command reception cannot be 100% reliable. It might be 99% reliable, but we must still be prepared to lose some commands, and we must be able to tolerate corrupted commands. Thus we expect to add a cyclic redundancy check to the command transmission protocol, and a means by which the ISL can inform the control system that commands have gone missing.

Tuesday, September 25, 2012

Taper Light Source

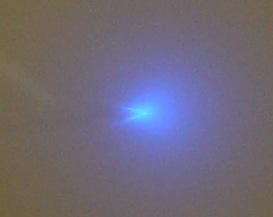
The photograph below shows a glass taper emitting blue light in all directions. The fiber is the silica-silica WF300/330P37 from Ceramoptec. Its silica core is 300-μm in diameter, with a 15-μm layer of silica cladding around the outside.


The numerical aperture of this fiber is such that any ray within the core that makes less than 14° with the axis will be constrained within the core by total internal reflection at the core-cladding interface. We see no sign of the blue light within the fiber until it reaches the taper. Within the taper, the blue light reflects off the sloping walls of the fiber. These reflections increase the angle the light rays make with the fiber axis. Eventually, the light no longer reflects off the the core-cladding interface, nor even the cladding-air interface. The tip of the fiber shines with blue light.

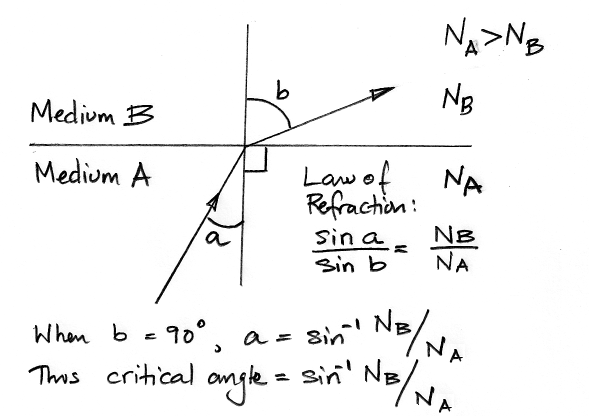
When a ray of light passes through a decrease in refractive index, its will turn towards the plane of the interface. The diagram below shows how rays with an angle of incidence greater than a critical angle will be reflected.


Our fiber has numerical aperture 0.37, which means rays in air that enter a polished, perpendicular fiber tip will end up propagating down the core if they lie within 22° of the fiber axis. The fiber silica has refractive index roughly 1.58. When a ray at 22° enters a fiber, it bends towards the axis and propagates at an angle of 14°. The critical angle of the core-cladding interface is 76°. The ratio of the core refractive index to the cladding refractive index is 0.97. If we assume the core has refractive index 1.58, the cladding must have refractive index 1.54.

With the taper in air, however, we have the cladding-air interface to perform internal reflection as well. Because the refractive index of air is 1.0, the critical angle of this interface is 40°. In the photograph we see light escaping from the taper only when it gets within 300 μm of the tip. When we immerse the taper in water, however, light starts to escape farther from the tip. The refractive index of water is 1.3, so the critical angle of the cladding-water interface is 50°. The following photograph shows the same fiber tip immersed in water with a suspension of fine particles to scatter the emitted light.


The light starts to escape the fiber roughly 600 μm from the fiber tip. Most of the light emerges within a 90° cone. But the fact that we can see the taper clearly from the side demonstrates that the taper emits in all directions even when immersed in water.

Wednesday, August 15, 2012

High NA Fibers

Our last two posts have concerned the efficiency of coupling light into fibers. We've been asked whether we can use a fiber with a higher numerical aperture to improve this efficiency. In principle, the answer is yes. If we used a fiber with a numerical aperture of 0.50, accepting rays up to 30 degrees from the optical axis, we'd capture approximately twice as many rays as a fiber of the same size with NA=0.37. However, we've been unable to source fibers that both have such large acceptance cones and meet our project's other requirements.

We are currently Optran Ultra fibers which have a silica core, silica cladding, and a polyimide coating. Their numerical aperture is 0.37. The polyimide coating serves no optical purpose and is burned off in the tapering process, leaving an all-glass fiber.

There are 0.48 NA fibers available from Thorlabs (such as PN: BFL48-400), which are constructed of a silica core, polymer cladding, and Tefzel buffer. One such fiber has a 400μm core and 430μm cladding, but the Tefzel buffer is 730μm in diameter. We cannot taper these fibers without destroying the polymer cladding. We could simply polish the end of the fiber and insert it into the brain, but the blunt end would cause more tissue damage than a tapered fiber. Another problem arises with the Tefzel buffer. It is thick, making the fiber's cross sectional area 2.75 times larger than a fiber with the same core size and a 440μm total diameter (as is available in 0.37NA). We expect this greater size may be more invasive. We could attempt to strip the Tefzel coating off of the fiber, but Thorlabs warns against this:
The cladding material utilized to achieve the large NA of these fibers is a softer polymer than normally found in polymer clad step-index multimode fibers. Consequently, the cladding material has a higher probability of being removed from the fiber when the buffer is being stripped for normal connectorization.
There are other high NA fibers on the market. The Optran Ultra line includes fibers with numerical apertures greater than 0.37, but these fibers also rely optically on a polymer cladding. Their construction consists of a glass core, glass cladding, polymer buffer, and Tefzel jacket. According to a company representative whom we spoke with, the the polymer buffer is optically active. These fibers are, effectively, double step index fibers. We anticipate the same difficulty stripping them as we would encounter with the Thorlabs fiber. Like the Thorlabs fiber, the thick Tefzel coating increases the total size without increasing the light-gathering surface area. For example, the NA= 0.53 fiber has a core diameter of 200μm has a total diameter of 500μm (compared with our current use of 300μm core, 330μm total). In this case, the high NA fiber would only have 44% the light gathering surface of our current fiber, but over 2 times the total cross sectional area - making it more intrusive for similar power delivery.

Dennis Kaetzel has pointed us to "page 30 in the doric catalogue attached for 300um / 0.48NA and 200um / 0.53NA". We are investigating this fiber. If its construction is all-glass, unlike that sold by Thorlabs and CeramOptec, we ought to be able to achieve great capture efficiency and make tapers out of it. Otherwise, the difficulties discussed above remain.

According to Shibata et al. in "High Numerical Aperture Multicomponent Glass Fiber", a glass made of 40% PbO by weight will have refractive index 1.65 as compared to usual glass with index 1.55. Using the lead glass as a core we could obtain a numerical aperture of 0.56. In practice, they obtained 0.50. This would give us an acceptance cone of +-34 deg. Compared to our existing +-22 deg, we would get double the capture efficiency. It may be that all-glass fibers like this are not commercially available. Perhaps in the future we could custom order this kind of fiber. In the meantime, we can continue to refine our tapering and production process. The construction techniques we develop ought to carry over easily to any all-glass fiber that we find in the future.

There is an alternate way to use polymer-cladded fibers. We have equipped our tapering machine with an oxy-hydrogen micro torch as the heater. It produces a very small hot-zone. When we turn the flame on, it heats a length of fiber under 1mm long to glowing hot. This is the region of the fiber that is tapered (we produce gradual tapers by translating the hot zone along the length of the fiber). We begin tapering fibers with the polyimide still intact and it is burned off by the heat. The polyimide coating burns back approximately 2mm from behind the hot zone. Supposing that we were able to successfully strip the Tefzel coating off of a high NA fiber without damaging the polymer cladding, we could taper it and accept that the polymer coating will be damaged. We don't know how the polymer coating withstands heat, but it might be possible that is not damaged much more than polyimide. In this case, we could have a sharp, short taper (1mm long) at the tip of the fiber that minimizes damage to neural tissue upon insertion. Immediately behind the taper would be a 2mm zone of bare glass where the polymer cladding will have been burned off.

Illustration: A 0.48NA optical fiber with one end tapered. The polymer cladding is removed for 2mm behind the tapered region due to the heat of the tapering process.

Where exactly the light is emitted from the fiber using this approach would depend heavily on the optical properties of the brain. If its refractive index is uniformly similar to water, the brain may act as cladding and most light would not exit the fiber until the tapered region. If, however, there are a sufficient number of particles of high refractive index which interact with the fiber, the majority of light may be pulled out of the 2mm long section without cladding. In that case, it may be impossible to concentrate light output into as small of a volume as is possible with our current approach.

To this point, our work has been focused on all-glass fibers, so we will continue working with all-glass, NA=0.37 fiber, and plan on experimenting with other approaches as we perfect the tapering and production process. We will readily experiment with high NA fiber made of all glass if we can find it.

Thursday, August 9, 2012

LED-Fiber Coupling

We have developed a system of coupling optic fibers to LEDs. We use a bare Cree C460EZ500 die that has been bonded to a surface mount chip and has had its cathode wire bonded to one of the chip's pads. The die's light emitting surface is exposed to air so that an optical fiber can be lowered directly onto it. We mount this chip onto a simple PCB and screw the PCB onto a three-dimensional micrometer stage. The optic fiber is held by a clamp while the stage manipulates the PCB, raising the die to the fiber. We use a digital microscope to monitor this progress.
Image: EZ-500 bare die (white) bonded onto a surface mount chip. The die measures 480x480μm, while the chip measures 3.25x3.25mm. Wire-bonded anode and cathode wires are visible connecting to the chip's pads.

We used our stage to abut several kinds of optical fiber to the LED, one at a time, to test the coupling efficiency (the amount of light captured by the fiber, divided by the die's total output). For fibers with cross sectional area smaller than the area of the die, this simple abutment of fiber end to the die is the most efficient method of coupling light into the fiber, as discussed by Hudson, 1974. We abut one end of a 15cm length of fiber to the die. We then measure the coupling efficiency by measuring the light output at the distal end of the optic fiber and dividing this by the total optical power of the LED. We measured the coupling efficiency of four different fibers to range from 0.12% to 17% (for {62.5micron core, NA = .22} and {400micron core, NA=.37}, respectively).

Images: Above, a fiber with a 300μm core, 360μm total diameter. The fiber is not centered over the die, but is instead adjacent to the gold bond pad. Below, a fiber with 62.5μm core (125 μm total) is centered over the die. Click for larger version.

We summarize the coupling efficiency of four different fibers in the table below. The measurements were taken with 72.1mA passing through the EZ-500. Total output was measured to be 56.3mW. We will provide a discussion of these results in our next post.


Image: Light being coupled into a 300μm core fiber.


References:
M. Hudson, "Calculation of the Maximum Optical Coupling Efficiency into Multimode Optical Waveguides," Appl. Opt.  13, 1029-1033 (1974).

Theoretical Capture Efficiency

The intensity of light emitted by an LED is greatest in the direction perpendicular to its surface. The EZ290 data sheet shows the irradiance of the LED varying approximately as the cosine of the angle from the normal to the LED surface. If we place a fiber with numerical aperture a above the LED, so that it is perpendicular to the LED surface, and the fiber is large enough that all the light emitted by the LED enters the core of the fiber, we see that light within an angle φ = arcsin(a) of the fiber axis will propagate by total internal reflection down the length of the fiber. The following calculation shows how the fraction of the LED power output propagating down the fiber will vary with φ


We have fibers with numerical aperture 0.37, for which we obtain φ = 22°. Of the light entering the core of such a fiber from the LED, we expect only 14% to propagate down the fiber. If the fiber is too small in diameter to cover the entire LED surface we expect our capture efficiency will be even lower.

Thursday, July 12, 2012

The Source of EEG

We have concluded our investigation into the sources of EEG, arriving at working hypothesis. We present our calculations and analysis in The Sources of EEG. The EEG signal is a potential in the extracellular fluid above the cortex. We can detect it well with a screw electrode 1 mm in diameter. Such an electrode cannot detect individual action potentials. The EEG signal results from tens of thousands of neurons acting coherently.

We believe there are two sources of the EEG signal. One is excitory post-synaptic currents flowing into the synapses of pyramidal neurons, down the apical dendrite, and out of the soma membrane capacitance. Current enters the extracellular fluid outside the soma and leaves it at the synapses, thus generating a current dipole in the extracellular fluid. When many, parallel pyramidal neurons act together, the effect of these circulating currents combines to produce a negative EEG voltage of order −1.5 mV for at least 10 ms.


The second source is a consequence of neuron activation. As activation starts in the soma and propagates down the apical dendrite of a pyramidal neuron, there is a fraction of a millisecond during which current is flowing along the apical dendrite prior to its activation. This current flows from the activated soma, along the apical dendrite, and out through the membrane capacitance of the dendrite endings. We call this the exctracellular activation current, because it flows from the dendrite endings, through the extracellular fluid, to the soma. We estimate it to be ten times the magnitude of the extracellular excitory current prior to activation, but its direction is opposite and its duration is only 1 ms.

With excitation of a layer of pyramidal neurons spread over 10 ms, we expect the activation to be spread out over a similar interval, so that the average activation current will be comparable to the excitory current, producing a +1.5 mV contribution to the EEG.

We believe that the baseline EEG signal, its usual frequency spectrum, hiss artifacts, spindle artifacts, and negative-going seizure spikes are all consistent with our hypothesis. But oscillations of greater than 150 Hz in the EEG are not.