Tuesday, October 29, 2013

Higher-Index Taper

In one of our earliest posts, we described how an electric heating element was unable to heat silica-silical fiber to its 1100°C softening point. Our high-index fiber and our higher-index fiber soften at around 430°C. We equip our motor-driven tapering machine with a coil of nichrome wire, potted in high-temperature cement and produce the taper shown below.


Figure: Taper in 410-μm Higher-Index Fiber. Blue 460-nm light. Taper is 2.0 mm long.

The taper shown above is at the top of a 40-mm shaft of higher-index fiber, polished at the base. Its diameter is 410 μm. We lower the base onto a C460EZ500 blue LED die. This particular LED has output power 27 mW (4.85 mA photocurrent through unbiased photodiode) for forward current 30 mA. Because we were in a hurry, we fastened the fiber to the LED with five-minute epoxy. We bake it in our oven at 60°C and within twenty minutes, the epoxy is fully cured.

We drive 30 mA through the LED. We press our 10 × 10 mm2 photodiode against the side of the fiber, so that the axis of the fiber is a millimeter from the photodiode window. We expect light emitted by the taper more than 20° from the fiber axis, and in a ±80° slice in the radial direction, to enter the photodiode. We see 3.7 mW (0.67 mW photocurrent). We hold the photodiode 15 mm from the top of the taper, and perpendicular to the fiber axis. We now receive most of the light within ±20° of the axis. We see 1.1 mW (0.2 mA photocurrent). Multiplying the first measurement by 2*9/8 and adding the second, we arrive at 9.4 mW total emission from the taper. Assuming 2.2% loss per 10 mm, the power entering the base of the fiber should be 10.3 mW, which is 38% of 27 mW.

We produced four such tapers from two lengths of higher-index fiber polished at both ends. The one we show above is the shortest. We can make them in the same machine with 6 mm of fiber followed by 2 mm of taper. Such a fiber would emit around 10 mW from its tip for 30 mA of LED current.

Thursday, October 24, 2013

Yellow Glass

Yesterday we were mystified when our coupling efficiency dropped from 39% to 21% when we applied glue to the base of a 146-mm higher-index fiber. Today the epoxy is cured. The fiber is attached firmly. There are only a few small bubbles in the glue, towards the surface. We apply 30 mA to the LED. When the glue was curing yesterday, we obtained only 5.3 mW at the top end of the fiber. Today we obtain 8.2 mW. Yesterday the total power output of the LED at 30 mA was 25.7 mW. Our capture efficiency appears to be 32% now the glue has cured, but was only 21% while it was liquid.

Most of our 146-mm fiber is in air. The bottom 4 mm are covered with glue of refractive index 1.5 and a 3-mm section is clamped in steel. It may be that some light is propagating up the fiber in the cladding by total internal reflection at the cladding-air boundary. We apply clear epoxy to 30 mm of the fiber, near the top. The power at the tip remains 8.2 mW. We conclude that the 4-mm coating of epoxy at the base is sufficient to cause the loss of all light except that which is captured by the core.

We cut back the 146-mm fiber to 30 mm and polish the tip. We apply 30 mA and obtain 10.6 mW at the new tip. The fiber and LED are shown below. The conical angle of the emission from the fiber tip is around ±60°, which is consistent with a numerical aperture of 0.86.


Figure: A 30-mm Higher-Index Fiber. Click on image for higher resolution. The base is glued to a C460EZ500. The tip is polished.

The T5 glass used by Fiberoptics Technology is a proprietary glass with index 1.72. The manufacturer tells us the glass is "very yellow", which we take to mean that it absorbs blue light. A similar glass with index 1.72 made by Schott, P-SF69, has transmission over 10 mm of 98.5% at 460 nm. Suppose the T5 glass has transmission η after 10 mm, and the power coupled into our fiber at the base is P, then Pη3.0 = 10.6 mW and Pη14.6 = 8.2 mW. From this we conclude that P = 11.3 mW and η = 97.8%.

With 11.3 mW out of 25.7 mW being coupled into the core of our fiber, our coupling efficiency is 44%. Our calculated coupling efficiency for this arrangement is only 38%. It may be that the LED is producing more power today than yesterday. If it is producing 28 mW, which is what we are hoping for from these LEDs, then the coupling efficiency is closer to 40%.

Yesterday, we were mystified because we assumed our fiber in air was not able to transport light in its cladding, because of dirt on its surface, and because of the metal-glass contact in the fiber clamp. And we had forgotten about the absorption of blue light by this high-index glass. Furthermore, there appears to be some problem with the coupling when the glue is liquid, and this we still do not understand.

We have a fiber that produces 10.6 mW at its tip with 30 mA LED current. If we taper the fiber to a total length of 8 mm, which is our intention for the head fixtures, we expect to get 11 mW out of the taper. If we increase the LED current to 50 mW by using shorter steel leads, the power at the taper should increase to around 18 mW.

Wednesday, October 23, 2013

Gluing Loss

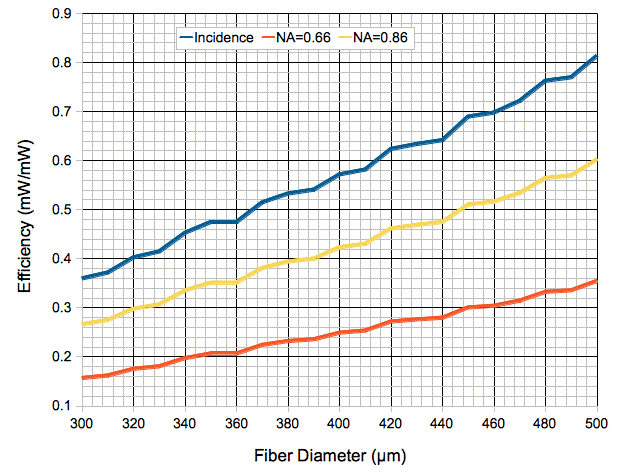
We take a 150-mm section of our higher-index fiber (NA = 0.86) and polish it at both ends. The diameter of this section is 410 μm.. We lower one end onto a C460EZ500 blue LED die. According to our diameter and location simulation, the best coupling of light from the LED to a 410-μm fiber occurs when the fiber is roughly 40 μm offset from the center of the die, in the direction opposite to the bond pad. We calculate that 58% of the light emitted by the LED will be incident upon the fiber base.

In practice, however, we find we cannot lower the fiber into this optimal position because the wire bond on the bond pad is around 100 μm high. We tried raising the fiber above the wire bond, but we obtained the greatest coupling efficiency with the fiber placed flat on the surface of the LED as close to the center as we can get it. The result is shown below.


Figure: Offset Fiber. This 410-μm diameter fiber is roughly 120 μm from the center of the EZ500.

With the fiber 120 μm from the center, our incidence calculation suggests we will get 52% of the LED light incident upon the base of the fiber. With NA = 0.86, we expect 74% of the light incident upon the base of the fiber to emerge at the other end, for an expected total capture efficiency of 38%.

We run 30 mA of current through the LED. The power emitted by the far end of the fiber is 9.8 mW (photocurrent 1.77 mA and sensitivity 0.18 mA/mW). We remove the fiber and measure 25.2 mW total power output (photocurrent 4.53 mA). Our coupling efficiency is 39%. We re-position the fiber several times. We obtain 38% or 38% coupling efficiency each time.

With the fiber in place, we inject E-30CL clear optical epoxy (RI = 1.5) into the LED package. The epoxy flows around the fiber and LED. The result is shown below, with a few milliamps of current in the LED.


Figure: Offset Fiber with Clear Glue.

As soon as the glue has surrounded the LED, the power at the fiber tip drops from 9.8 mW to 5.3 mW (photocurrent 0.95 mA). We raise up the base of the fiber and remove it from the glue blob and measure the total LED output to be 25.7 mW (photocurrent 4.62 mA). We replace the fiber and place it in its previous position. Once again we obtain 5.3 mW at the fiber tip. Our coupling efficiency has dropped from 39% to 21% with the application of glue.

Right now we have no explanation for this dramatic drop in coupling efficiency with the application of glue. So far as we understand, the a thin layer of transparent material between the fiber and LED will not stop light entering the fiber. Nor will glue on the outside of the fiber reduce its numerical aperture below 0.86. Nevertheless, the effect is real and repeatable. We have observed it many times, today being merely the most detailed observation of the effect to date.

Tuesday, September 24, 2013

Isolation Chamber for IVC Rack

When we apply the principles presented in Radio-Frequency Isolation Chamber, we arrive at the following solution for enclosing a large IVC (Individually Ventilated Cage) rack, such as the AERO80 from Tecniplast.


Figure: Proposed Radio-Frequency Isolation Chamber for a Large IVC Rack.

The chamber consists of absorber back and side walls, reflecting front wall and base mat, and open ceiling. Our sketch does not show the ventilation ducts entering and leaving the rack, but these can pass out above and below, or to the rear of, the side walls. The rear wall is 1.83 m square, made of 9 AN-77 absorbers. The gray side of these absorbers faces the cages in the rack. The black side is glued to an aluminum backing, which faces outward. The side walls are of the same construction, but made of 3 AN-77 absorbers each. In front of the rack is a curtain of transparent, conducting steel mesh. Below is a rubber mat that conceals a sheet of conducting fabric.

Radio waves approaching the isolation chamber are reflected away unless they pass through a gap or the ceiling. Such waves will pass through the rack once. If they arrive at an absorber wall, the chance of them being absorbed rather than reflected is 98.2%. If they hit the curtain or the mat, they will certainly be reflected, and so pass through the chamber a second time. If they reach the ceiling, they will exit the chamber. Such a chamber should reflect away 90% of incident interference. Some of the interference entering the chamber will pass through its volume twice because of the front and bottom reflectors, so interference power inside will be of order 15% the power outside. This 85% isolation is sufficient to guarantee 70% reception from an implanted transmitter at range 30 cm in the presence of −48 dBm interference, which is the strongest we have observed.

We arrange the eight independent antennas of Data Receiver (A3027B) on the shelves of the IVC rack. The sketch below shows how we might arrange these antennas to record from eight animal cages.


Figure: Proposed Arrangement of Antennas in an IVC Rack.

If we have a = b = 30 cm, and we consider the top-right cage, with an implanted transmitter on the far-right of the cage, we see that our arrangement provides two antennas at 30 cm, one at 42 cm and another five at greater ranges. We note that, because of the reflecting curtain at the front, there are two paths for radio waves to reach more distant antenna from our top-right transmitter. If we assume 70% reception for antennas at 30 cm, 50% from the antenna at 42 cm, and 20% from antennas up to 120 cm, and we further assume independence of message loss, we expect combined reception to be 98.5%.

We propose that ION perform the detailed design and construction of the rear and side absorber walls and the curtain rail. The walls should support the absorbers a few inches above the ground, and we should be able to remove each wall independently for comparative tests. The curtain rail likewise we should be able to remove with the entire curtain attached. We further propose that ION will select a rubber mat suitable for supporting the rack above the base reflector. At OSI, meanwhile, we will sew together the steel mesh curtain and cut the base reflector. We will prepare an A3027B Data Receiver and design a new loop antenna that fits easily between cages. We will provide transmitters to implant if necessary, so that we can test reception from within live animals.

UPDATE: [28-FEB-14] We make a curtain 2.0 m wide and 2.2 m high with curtain rings for the chamber test at ION. We hang the curtain in our office. We lay down a mat of copper teffeta fabric. We make a 1.2 m × 1.2 m absorber back wall and two 1.2 m × 0.6 m side walls. We suspend a piece of resistive sheet above the isolation chamber thus created. The result is shown below.


Figure: Isolation Chamber with Front Curtain.

We place three antennas on a table inside the chamber and three transmitters, which we move around to different places on the table. Reception without the chamber is 0-100% because of intermittent −58 dB ambient interference at 926 MHz. With the chamber as shown, we get reception 95-100%. When we move aside the curtain, reception drops to 70-100%. Peak interference power in the closed chamber is around −64 dB.

Monday, September 23, 2013

Radio-Frequency Isolation Chamber

A Faraday Cage provides isolation by reflecting incoming RF (radio-frequency) waves. We could instead provide isolation by absorbing incoming waves. The AN-77 is a 61-cm square of conducting foam that absorbs 90% of incident 900-MHz radio waves when it is free-standing without a conducting backing. We set up the following chamber on our office floor.


Figure: Coffin-Like Absorbing Enclosure. Floor is reflecting sheet, walls are AN-77 absorbers.

The purpose of any chamber we might build around our SCT system is to promote reliable reception. The chamber can do this in two ways. One is to attenuate external interference. Another is to increase the power we receive from our transmitters. Our new Data Receiver (A3027) provides eight independent antenna inputs. Each has its own amplifier, demodulator, and message detector circuit. With eight antennas, we need only one to pick up a transmitter message. An isolation chamber with one or two reflecting walls can make it more likely that a message will be received by an antenna 100 cm away.

In the coffin-like enclosure shown above, we see three antennas on the floor. These are each independent and connected to our prototype A3027. They are separated by 30 cm, which is enough for a rat cage. We hold an A3019D transmitter in our hand, with the antenna protruding into air, and move and rotate it at random in the 30-cm cube between the left and center antenna. We obtain 100.00% reception over one minute. That is to say: we do not lose a single message. If we disconnect the right-most antenna, reception drops to 98.2%, and if we disconnect the left-hand antenna as well, reception drops to 96.6%. We perform the same measurements with the entire transmitter and antenna enclosed in our hand, so the antenna is enclosed in human tissue at least 2 cm deep. We connect all three antennas. We obtain 99.3% reception. We remove the enclosure and repeat our measurement with only the center antenna connected, and the transmitter in our fist. We obtain 38% reception.

Interference power in our office is −48 dBm, which is as great as we have seen in any laboratory. Reception with one antenna at ranges up to 30 cm is only 38% when we mimic implantation by holding the transmitter in our fist. With three antennas inside our coffin-like absorbing enclosure, however, reception rises to 99.3%.

The dramatic improvement in reception is provided by the slight attenuation of external interference provided by the absorbing walls of the coffin. But it is also provided by the reflection of radio-waves towards the more distant antenna by the floor of the enclosure. Within the chamber, we are more likely to pick up signals with the distant antenna than outside.

Thus we propose to place a wall of absorbers behind and to either side of an IVC rack, a curtain of conducting mesh fabric in front, and a mat of conducting fabric below. These precautions, when combined with eight independent receiving antennas, may give us reliable reception inside the rack.

Now suppose we have two such racks in one room. Our absorbing enclosure will not guarantee that the antennas in one rack will not pick up signals from the other rack. Reception from the neighboring rack may be poor and rare, but it cannot be stopped entirely. Thus we must add one more feature to our SCT system. We propose that new transmitters broadcast a set number between 1 and 15 after their existing message bits. Meanwhile, we will be able to configure our A3027 data receivers so that they reject messages from all but one set number. Thus we can operate transmitters with set number 1 in an IVC rack next to transmitters with set number 2. The transmission of the set number will come at a slight cost in current consumption: battery life will drop by roughly 10%.

The scheme we have described has the advantage of being far more practical than the original sealed and reflecting faraday enclosure. We merely hang walls of absorbers around the back and sides of the rack. We have a curtain that can be pulled aside from the cages in front. We do not have to seal any gaps. Our multiple antennas and the transmitter set numbers provide reliable reception at the same time as stopping cross-talk between adjacent SCT systems. Our hope is to test this scheme at ION at the end of October.

Failure of the Faraday Canopy

Our FE2B Faraday enclosure provides a minimum of 20 dB (99%) rejection of interference power. As we described earlier, we hoped to duplicate this performance on a larger scale, so as to enclose an entire IVC (Individually Ventilated Cage) rack. The photograph below shows our faraday canopy with three towers of AN-77 absorbers in a triangle. Each AN-77 absorber is 61 cm square.


Figure: Triangle of Absorber Walls in the Faraday Canopy. Kirsten is standing still so as to allow us to obtain a stable interference measurement with the antenna resting upon the stool.

With no absorbers in the canopy, we usually obtained 10 dB isolation. With six AN-77 absorbers standing on the floor, we sometimes obtained 20 dB isolation, but often as little as 6 dB. With nine AN-77 absorbers in a wall 1.8-m square, we usually obtained 20 dB isolation, but sometimes as little as 6 dB. In one experiment, we observed the isolation to changed from 7 dB to 20 dB as the experimenter inside the enclosure changed where she was standing. (You will find a complete account of our experiments here.)

If we are to enclose an IVC rack, we must accommodate the two ventilation pipes. Catherine tried running the ventilation through steel mesh fabric, in the hope that we could simply pass the air through the sealed enclosure, but the result was dirt building up in the mesh, which degraded the performance of the ventilation. Thus we would have to insert two breaks in the enclosure of around 10 cm diameter each. This diameter is one third of our 900-MHz radio-frequency data wavelength, and so would allow interference to enter the cage, and once inside, the interference would reflect off the canopy walls until it struck an absorber. A sock of reflecting mesh around the ventilation pipe will not stop the penetration of interference, because once inside the sock, the radio waves will continue bouncing along its length until they enter the enclosure.

Even if we could improve the isolation of such an enclosure to 20 dB in the presence of ventilation holes, there remain many practical difficulties in moving the IVC rack into and out of the enclosure, and in supporting a sealed enclosure around the rack. Thus we have abandoned our plan to make a faraday canopy for the IVC. But we do have an alternative, and we will describe this alternative in our next post.

(NOTE: Our continuing work on radio-frequency isolation for IVC racks is funded by a budget separate from our ISL development budget, but we present the work here for want of a better venue, and because it is relevant to the ISL implementation.)

UPDATE: [01-JAN-14] We suspect that the poor performance of our faraday canopy is due to the canopy itself acting as a resonator in combination with the shield of our pick-up antenna cable or with the antenna itself. Any break in the canopy, such as an imperfect seam, can turn the canopy from an isolation chamber into a resonant cavity, as described here. Our cable sock will act as such a break, and cables passing through the sock can act as one half of a dipole antenna with the canopy, picking up energy incident upon the outside of the canopy. Solving these problems would be impractical for a canopy used in animal experiments, in which the experimenter should be able to enter and leave easily, and through which we must be able to pass ventilation pipes.

UPDATE: [28-FEB-14] We set up the faraday canopy in our new office. Ambient 902-930 MHz interference peaks at −43 dBm on our work bench. It enters via the roof and windows only, because we are in a basement. We place three antennas inside the cage, one on the floor and two on a box. We tape the shields of all three cables to the copper fabric floor of the canopy. Interference peaks at −61 dB, −52 dB, and −64 dB on the floor, box, and box.

Thursday, May 30, 2013

Higher-Index Fiber

We receive from Fiberoptics Technoligy a new batch of fiber. As with our High Index Fiber, the core occupies 83% of the cross-section and the cladding the remaining 17%. This time, the core is made of a proprietary glass of refractive index 1.72, which they call TD5. The cladding is Schott 8250. The core numerical aperture is 0.86.

The fiber is divided into 178 sections, each 9 m long, so that the total length of fiber is around 1600 m. We took a 10-cm sample from each 9-m section and measured its diameter. Of these, 165 had diameter 390-440 μm, and 13 had diameter 130-310 μm. We set aside the thinner fibers and consider the 165 larger fibers. The histogram below shows the distribution of their diameters.


Figure: Distribution of Section Diameter

We were hoping for an average diameter of 440 μm and a range of 400-480 μm. What we have is an average diameter of 411 μm with range 390-440 μm, which is similar to the distribution of our previous high-index fiber.

From the 1600 m of fiber we have 100 m with diameter 430 μm or higher. We need 50 mm to make one 8-mm fiber taper, so we have enough fiber in stock to make two thousand fiber tapers of base diameter 430 μm. According to our calculations, the 430 μm diameter should capture and transport 64% of the light emitted by an EZ500 LED. With 30 mA of LED current and 28 mW of blue light emitted, we are hoping to see 18 mW at the fiber tip.

UPDATE: [28-JUN-13] We find a piece of TD5 fiber with diameter 450 μm. We polish both ends of a 80-mm length. We cover 20 mm of the fiber with nail polish. We run 30 mA through an EZ500 460-nm blue LED and obtain 31 mW emitted power. We lower the fiber onto the LED and obtain 16 mW at the fiber tip, which is 50% capture efficiency, and consistent with our earlier calculations for a fiber of numerical aperture 1.72 and diameter 450 μm.