Monday, March 10, 2014

Performance of Chamber for IVC Rack

On 05-MAR-14, in the new animal room on the tenth floor at ION in London, we test reception in an IVC rack with and without the radio-frequency isolation chamber shown below. Each cage is for one or more mice, and has a metal grating to hold food pellets under the lid.


Figure: IVC Rack with Isolation Chamber. We have a sheet of copper taffeta fabric on top and bottom. Behind and to the sides are walls of AN-77 absorbers backed by aluminum sheet. In front is a curtain of steel mesh fabric. Antennas are at locations marked "X". Cage labelling scheme as marked on the rack.

We place the eight antennas of an Octal Data Receiver (A3027B) between the floors of cages B7-F7 and B6-F6. We measure reception in the rack by removing one cage and rotating and translating an subcutaneous transmitter (A3019D) on the end of a stick for one minute within the volume the cage would have occupied. We record the fraction of messages received. When the curtain is in place, we cut a hole in the curtain and pass the stick through the hole. Before we install the isolation chamber, we measure the reception in cage spaces as follows: E7 = 92.5%, E6 = 99.2%, E5 = 96.7%, F7 = 85.1%, B7 = 91.6%, E7 = 91.8%, D5 = 99.6%. After we install the isolation chamber we get: E7 = 100.00%, F7 = 100.00%, H1 = 100.00%.

Without the chamber, reception is not quite good enough for reliable recording, even within 30 cm of two antennas. With the chamber, reception is 100.00% reliable everywhere.

Friday, February 21, 2014

Stage Four Delivery

We have five head fixtures and five implantable lamps ready to ship to ION. Shown below are 3 of A3024B-M (mouse-sized) and 2 of A3024B-R (rat-sized) implantable lamp with lithium-ion battery. Each circuit is encapsulated in clear epoxy and four coats of silicone. Each lead is terminated with a 300-μm diameter gold-plated pin. The red lead is L+ and the blue is L−.


Figure: ISL Stage Four Delivery of Implantable Lamp Circuits, A3024B-M and A3024B-R. The blue line is 50 mm long.

The operating range of these lamps for command reception in our basement office is at least three meters. But one of our concerns with the mouse-sized A3024B-M is the size of the antenna, combined with the short length of the leads. We are not sure how the surgeon can implant this device in a mouse with the antenna maintaining its shape and the leads reaching the skull. If the surgeon finds that there is insufficient space to accommodate the antenna as it is, he should feel free to deform its shape. Deformation of the antenna will reduce operating range for command reception, but we expect the range will still be over 100 cm.

The table below lists the characteristics of each lamp. We estimate the transmitter volume from caliper measurements. We charged the batteries just before encapsulation. We measure the lead resistance with a meter. The current delivered by a lamp circuit is limited by the resistance of its leads. Lamp circuit No2.4 has two solder joints in its leads at the base, where we replaced unstretched leads with stretched leads to allow the circuit to deliver more current.

Circuit
Number
Battery
Capacity
Body
Volume
Lead
Length
Lead
Type
Lead
Resistance
2.1160 mAhr4.8 ml100 mmStretched56 Ω
2.219 mAhr1.7 ml50 mmUnstretched55 Ω
2.319 mAhr1.7 ml50 mmUnstretched55 Ω
2.419 mAhr1.7 ml50 mmStretched29 Ω
2.6160 mAhr4.8 ml100 mmStretched56 Ω
Table: Characteristics of ISL Stage Four Implantable Lamp Circuits.

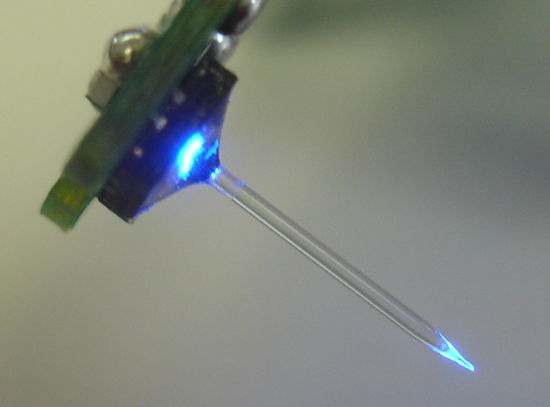
The photograph below shows one of five A3024HFB head fixtures. There is some deliberate variation in the way we aligned the fiber tip and the guide cannula. Click on the head fixture names to get a close-up picture of each one. In all cases, the fiber's outer diameter is close to 450 μm. The head fixture shown below is No2.11, an A3024HFB-G green lamp. Note that the glue does not extend to the contact between the guide cannula and the taper. In some head fixtures, the contact point is glued, in others it is not. In the former, we are sure there is no glue on the taper. In the later, we know that the guide cannula is fragile. We are also shipping A3024HFB-B No2.4, 2.9, 2.6, and A3024HFB-G No2.12. All are equipped with two sockets that accept 300-μ diameter pins. the L+ connection is marked "+" on the circuit board, and the L− connection is marked "−".


Figure: ISL Stage Four Head Fixture A3024HFB-G. The guide cannula is 15 mm long, and designed for a 22-gague needle. It is PlasticsOne part C313GS-4-FS-SP. The cannula ends 9 mm below the pedestal.

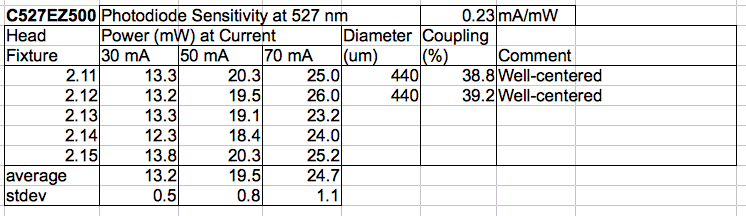
The characteristics of each head fixture are given in two tables for the blue and green versions. Any implantable lamp may be combined with any head fixture. By choosing which lamp circuit to combine with which head fixture, we can obtain more or less power at the fiber tip, and more or less operating life. The following table shows some example combinations.

Circuit
Number
Battery
Capacity
Lamp
Number
Light
Power
Light
Color
Lamp
Current
100% Duty
Life
10% Duty
Life
2.419 mAhr2.422 mWBlue70 mA5 min2 hrs
2.6160 mAhr2.126 mWGreen40 mA2 hr20 hrs
2.219 mAhr2.913 mWBlue42 mA10 min3 hrs
Table: Light Output and Operating Life of Various Combinations of Lamp Circuits and Head Fixtures.

If the capacity of a lithium-ion battery is C mA-hr, it can deliver up to C mA continuously while delivering its full capacity. At higher currents, its capacity decreases. But if it is allowed to recover after short bursts of higher current, it can deliver close to its full capacity. We present discharge graphs for our lamp circuit batteries here.

According to Bernstein et al., "To activate channelrhodopsin-2 and halorhodopsin molecules in mammalian neurons requires light of the appropriate color at a radiant flux of 10 mW/mm2 or greater, for maximal activation. A radiant flux of 1 mW/mm2 will activate approximately 50% of the molecules, and a radiant flux of 0.1 mW/mm2 will activate very few of the molecules." Light power density will drop with range from our fiber tip due to the geometric inverse square law, scattering, and absorption. Scattering causes power loss only because it encourages absorption by increasing the effective path length from the fiber tip. According to Johansson, the absorption coefficient of brain tissue is 0.35 mm−1 at 460 nm and 0.25 mm−1 at 527 nm. The scattering coefficient is around 1.2 mm−1 for both wavelengths.

Along a 1-mm path in the brain, 70% of photons will be scattered. Most of them will travel around 1.5 mm to arrive 1 mm from their starting point. Along this 1.5 mm path, 40% of 460-nm photons and 30% of 527-nm photons will be absorbed. If we consider a hemisphere around the base of our fiber tip, of radius 1 mm, its area is 2π mm2. If the fiber tip emits 13 mW of 460-nm light, the intensity on the surface of this hemisphere will be of order 13 mW / 2π mm2 × 60% = 1.2 mW/mm2. For 6 mW of green light we get 0.67 mW/mm2 at the same range. Our calculation is optimistic in that we assume the light is confined only to a hemisphere, but pessimistic because it ignores the fact that the light is being emitted all along the fibre tip, so the path length of most photons to the hemisphere surface will be shorter than we have assumed.

Thus we believe that our head fixtures can deliver over 1 mW/mm2 of 460 nm light and over 0.5 mW/mm2 of 527 nm light at a range of 1 mm from the fiber tip, and that this intensity will be sufficient to excite a significant proportion of opsin molecules in a 1-mm hemisphere.

Thursday, January 9, 2014

Taper and Guide Alignment

We receive 9-mm guide cannulas from Plastics One, part number C313GS-4-FS-SP. Following a discussion with Dennis Kaetzel last year, our plan is to glue the tip of the guide cannula to the base of the taper, so that they are joined, in contrast to our original head fixture design, where the guide cannula was pointing towards the taper but not attached to it.

The 9-mm guide is too long for head fixture A3024HFB No2.2, so we sand it down with 15-μm grit paper until it looks right. We glue it in place with five-minute epoxy. We manage to avoid blocking the guide cannula with glue, nor do we see any glue on the taper. The guide cannula and the tapered fiber are shown below, immersed in water, and emitting blue light.


Figure: Head Fixture No2.2. We sanded the 9-mm guide cannula down to a length of roughly 8 mm so that its tip would be adjacent to the base of the taper. The outer diameter of the fiber is 450 μm and of the guide is 700 μm. The misty blue light in the upper foreground is an artifact of the plastic petri dish between the water and our camera.

There are three ways to define the base of the taper. One is the physical base, where we first observe curvature of the outer glass. This is the definition we used when gluing the guide in place. We also have the point along the taper that first emits light when the taper is in air, and when the taper is in water. The taper emits light earlier in water than in air. The brain is mostly water, so we immerse the taper in water for the photograph above. The guide cannula ends 0.3 mm before the emission of light, and the emission of light is 1.0 mm from the tip of the taper, as measured along the fiber axis. Thus the light-emitting length of the taper in water is 1.0 mm.

Which is the best place to have the end of the guide cannula? At the physical taper base, or the water-emission taper base?

UPDATE: [27-JAN-14] Head Fixture No2.5 looks like this in water. The end of the guide cannula is 450 μm from the end of the taper, light-emitting length of the taper in water is 1000 μm.

UPDATE: [31-JAN-14] Head Fixture No2.7 looks like this in air. The end of the guide cannula is 600 μm from the end of the taper, light-emitting length of the taper in air is 700 μm.

Tuesday, December 31, 2013

Small Isolation Chamber

Open Source Instruments Inc. has moved from 397 Moody St, Waltham, MA, to 5 Pratt Ave, Waltham, MA. Our new office is a 180-m2 basement with a concrete floor and plenty of half-windows.


Figure: New OSI Location: 5 Pratt Ave, Waltham, MA.

On Moody St, interference power picked up by a Damped Loop Antenna (A3015C) in the 925-928 MHz band was up to −58 dBm (1.6 nW). Here on Pratt Ave, the same 925-928 MHz power peaks at −45 dBm (32 nW). On a work bench, reception from a subcutaneous transmitter only at ranges less than 10 cm. Interference power in our new office is four times greater than in any other place we have measured (London, Oxford, Edinburgh, Guildford, Waltham, Boston). Our new location is a fine place to test the efficacy of radio-frequency isolation chambers.

We set up a small isolation chamber. It consists of six AN-77 absorbers, gray sides inwards, standing on the concrete floor. We wrap an outer layer of resistive sheet around the absorbers. We put a cover of the same resistive sheet on top. We assume the floor is a perfect absorber, because we are in a basement.


Figure: Small Isolation Chamber on Concrete Floor.

We set up our A3008C spectrometer and measure 925-928 MHz interference power for one minute with the pick-up antenna on the corner of our work bench, on the floor out in the open, in the center of our isolation chamber, and in the corner of our isolation chamber.


Figure: Interference Power in Separate Minutes and in Various Locations.

The peak interference power outside the enclosure is −45 dBm. Inside the chamber, the power never rises above −68 dBm (160 pW). The chamber appears to provide 23 dB of isolation. We place a Subcutaneous Transmitter (A3019D) inside the chamber 50 cm from each of two antennas connected to an Octal Data Receiver (A3027C). Over the course of one minute we obtain 100.0% reception. We remove the enclosure lid and reception drops to 29%.

Tuesday, December 24, 2013

Command Transmission Noise

We turn on two Subcutaneous Transmitters (A3019). One has 150-mm leads and the other has 45-mm leads. We place the tips of the leads in water, so that they are connected by an impedance of order 100 kΩ. This connection reduces the amount of mains hum the transmitters pick up, allowing us to see other sources of noise. We turn on our Command Transmitter (A3023CT), which emits pulses of 146-MHz radio-frequency power to stimulate Implantable Lamps (A3024). We place the command antenna 70 cm from our two subcutaneous transmitters, and instruct the command transmitter to emit 10-ms pulses at 10 Hz. We see the following response from the subcutaneous transmitters.


Figure: Command Transmission Noise. Two A3019 subcutaneous transmitters responding to pulses of 146-MHz command pulses. Vertical range is 27 mV, horizontal range is 500 ms. Pulses are 10 ms at 10 Hz. Pink trace: 150-mm leads. Orange trace: 45-mm leads.

If we remove the leads from an A3019, we see no response to the command transmission. We record with a two-channel Subcutaneous Transmitter (A3028D) and observe the same pulses on both channels. We suspect that the leads pick up 146-MHz power, which penetrates the transmitter circuit and is somewhere demodulated by a non-linear element in the amplifier. The demodulated signal is added to the input, resulting in pulses. We record the following trace from an A3019 without encapsulation and equipped with 150-mm wire leads.


Figure: More Command Transmission Noise. One un-encapsulated A3019 responding to pulses of 146-MHz command pulses. Vertical range is 27 mV, horizontal range is 500 ms. Pulses are 10 ms at 10 Hz.

We add a 100-kΩ resistor in series with each lead, and a 10-pF capacitor at the far side of the resistors. Thus the resistors form a high-pass filter with cut-off frequency 80 kHz. At 146 MHz, the filter attenuates by a factor of two thousand in amplitude. A 20-mV pulse of command transmission should be reduced to 1μV. With the filter installed, we recording the following trace from the subcutaneous transmitter with the same command pulses.


Figure: Eliminated Command Transmission Noise. One un-encapsulated A3019 equipped with 80-kHz low-pass filter showing no response to pulses of 146-MHz command pulses. Vertical range is 27 mV, horizontal range is 500 ms. Pulses are 10 ms at 10 Hz.

The 10-pF capacitor of the filter appears in parallel with the 10-MΩ input impedance of the subcutaneous transmitter's EEG amplifier, making a low-pass filter with cut-off frequency 1.6 kHz, which is above the 1.3-kHz bandwidth we would obtain from an A3019 running at 4096 SPS. The two 100-kΩ resistors form a divider with the 10-MΩ input impedance, which reduces the EEG signal amplitude by 2%, which is insignificant. We claim this filter will have no effect upon the detection of EEG, and yet eliminates the command transmission noise.

Wednesday, December 18, 2013

Taper Power Measurement

We have three ways to measure the power emitted by a glass taper. For all methods, we mask the LED with black tape and we use our SD445 photodiode. The photodiode measures 10 mm × 10 mm. With no reverse bias, this photodiode has sensitivity 0.18 mA/mW at 460 nm (see LED Efficiency). In the first method, we measure the light intensity emitted in an array of directions and integrate over a hemisphere to obtain total emitted power. In the second method, we place our photodiode in five locations to make a virtual cube of photodiode 10 mm on each side, centered on the taper. We add the photocurrents together and so obtain an estimate of total power. In the third method, we hold the photodiode as shown below.


Figure: Single-Location Measurement of Taper Power Output.

The transparent plastic surface of the photodiode reflects light with angle of incidence greater than 80°. The above arrangement results in the photodiode receiving light emitted by the taper within a ±80° wedge in the horizontal plane. To obtain total power emitted, we multiply the photocurrent by 360°/160° = 9/4 and divide by the sensitivity 0.18 mA/mW.

Of our three methods, the first is the most time-consuming and prone to error. The second is prone to error due to incorrect placement of the photodiode. The third is the easiest. We measured the power output of A3024HFB No2.9 with Method Two and obtained 10.8 mW at 30 mA forward current. We applied Method Three and again obtained 10.8 mW. From now on we will use Method Three and assume it is accurate to ±10%. We will refer to Method Three as the angled photodiode method. We use the angled photodiode method to measure total power output versus forward LED current for A3024HFB No2.9, and obtain the following plot.


Figure: Taper 2.9 Output Power versus LED Forward Current.

We see that the taper emits roughly 11 mW at 30 mA, 18 mW at 50 mA, and 22 mW at 70 mA. When the forward current is above 50 mA, however, the output power drops during the seconds after we apply the current. Thirty seconds after we apply 80 mA, the power has dropped by 10%. This drop is due to self-heating of the LED.

Friday, December 13, 2013

New Head Fixture

We have a new head fixture printed circuit board. It provides a notch for the guide cannula, rather than a hole. There is a two-way plug for delivering power during assembly, and two miniature sockets for pins during implantation. We mount ten C460EZ500 LEDs in QFN-8 packages into ten such circuit boards and measure their power output at various forward currents.


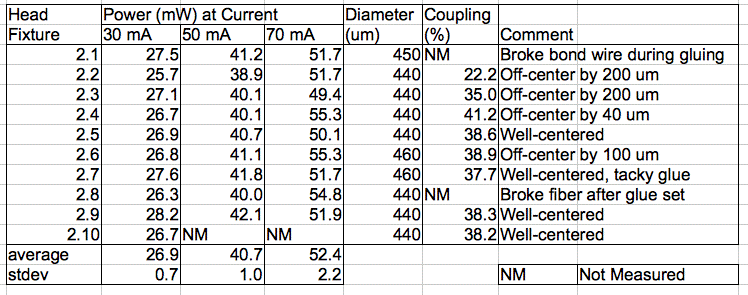
Figure: We give diameter of fiber we later glued to the LED and the coupling efficiency. The coupling efficiency is the fraction of light emitted at 30 mA that emerges from the fiber tip.

In series with the LED is a surface-mount resistor that allows us to set the LED forward current once we know the length of the power supply leads. We expect the leads to be 50 mm long in mice and 150 mm long in rats. The resistance of our stretched helical 100-μm wire leads is 10 Ω per 50 mm. The power supply is 5 V and the LED forward voltage is 3.2±0.1 V for currents of order 50 mA. With a 0-Ω resistor and 150 mm leads we will get 32 mA. With a 7-Ω resistor and 50-mm leads we will get 70 mA, assuming the battery can supply the required current to its boost regulator.

We make an 8-mm long fiber of higher-index glass. The fiber has a 2-mm taper at one end a flat on the other. Its diameter is 440 μm. We its base onto the center of the LED. We squash down the bond wire, but there remains a gap of roughly 100 μm between the fiber base and the LED surface. Our calculated coupling efficiency for a fiber with outer diameter 440-μm and numerical aperture 0.86 is 47%. We expect to lose 2% of this light in the yellow glass of the fiber, which will reduce our coupling efficiency to 46%. Our calculation assumes, however, that the LED and fiber surfaces are touching.


Figure: Higher-Index Taper Glued to Blue LED. Assembly number A3024HFB, serial number 2.10.

We mask the base of the fiber with tape and pass 30 mA through the LED. We measure the photocurrent in our 10 mm × 10 mm photodiode at range 20 mm for the fiber tip. We vary the angle, θ, between the axis of the fiber and the line joining the tip to the center of the photodiode. We orient the photodiode so its surface is always perpendicular to this line. For θ = 90° we go around the fiber in a horizontal plane in 45° steps. The light intensity varies from 50-110 μW/cm2, with an average of 80 μW/cm2. We move the photodiode in a vertical plane and vary θ from 90° to −90°. We obtain the following plot of intensity versus angle.


Figure: Intensity versus Off-Axis Angle for Fiber Tip. The fiber base is masked with black tape. We move our 1 cm2 photodiode around in a vertical plane at range 2 cm. Assembly number A3024HFB, serial number 2.10.

By integrating this curve for the hemisphere above the taper, we obtain a crude estimate of 9 mW for the total emitted power. To obtain a better estimate, we place our 1 cm2 photodiode in five positions on four sides and above the tip of the fiber, at range 5 mm, so as to make a cube that receives all emitted power. We add the photocurrents thus obtained, after subtracting for background light, and arrive at a total of 1.76 mA, which suggests a total output power of 9.8 mW at 30 mA forward current. Given that this LED emitted 26.7 mW at 30 mA, our coupling efficiency to the tip is 37%. We increase the LED current to 50 mW and optical power output increases by 45% to approximately 14.3 mW. For the first time, we have a taper that emits roughly 10 mW with forward current 30 mA. If we increase the LED current to 70 mA, which will be possible with a rat-sized lithium-ion battery, this fiber tip will emit 19 mW. This fiber's coupling efficiency is 37%, compared to a theoretical maximum of 46%.

To complete the head fixture, we need a 9-mm silica guide cannula. Our existing guides are 7-mm long. Our plan is to glue the tip of the guid to the base of the taper, and measuring with the existing taper, the guide cannula length below the plastic thread must be 9 mm.

UPDATE: [24-DEC-13] In No2.2, we use the offset placement of the fiber shown here, which allows us to press the fiber base onto the surface of the LED. We get 5.7 mW for 30 mA, or 22% coupling efficiency.

UPDATE: [23-JAN-14] By squeezing the fiber clamp with our fingers, we force the fiber base closer to the LED surface. This appears to increase our coupling efficiency from 37% to 38%.

UPDATE: [24-JAN-14] We take out head fixture A3024HFB No2.6 and measure its power output with 30 mA. We mask the LED with aluminum foil. With angled photodiode we get 10.4 mW total power output. With the fiber perpendicular to the photodiode and the tip touching the photodiode, we get 1.3 mA of photocurrent, or 7.3 mW incident light. Given that the photodiode extends for 5 mm from the tip, and the light emission takes place along a 1-mm length, everything emitted within ±84° of the fiber axis is incident upon the photodiode. The missing 3 mW must be emitted at an angle greater than ±84°.